Getting the Most Out of Embeddable During a Proof of Concept
A best-practices guide to building, shipping, and refining embedded dashboards as a part of a proof of concept with Embeddable.
Summarize with:
You’re looking to add analytics to your application and have landed on Embeddable as the solution. Great choice! Our developer-first embedded analytics platform gives you a robust and scalable foundation while also giving you complete control over the look, feel, and behavior of every single component on your dashboard.
This means you have tremendous power when it comes to designing and building views for your users. In order to harness that power, we’ve found that it really helps to decide on a specific approach to development and deployment of analytics to your users.
This best-practices guide based on our own experience and that of our clients is here to help you move forward! We’ll take you through a bunch of the things we’ve learned helping our customers get their dashboards launched. Like all advice, it should be taken with a grain of salt and adapted to your needs.
So, without further ado, here’s how to get the most out of Embeddable. We hope it helps!
Start Small
One of the most common bottlenecks we see with our clients is that they jump into dashboard development with grand ambitions. There’s nothing wrong with those, of course - you want to build something great! But in this building, you don’t need to finish (or even scaffold) the top floors before the bottom ones can open to the public. It’s often better to start small and then iterate, which we’ll get to.
One of the best approaches to starting small is determining what data will be most important to the largest subset of your users. For example, let’s say you’re a company that monitors construction-related delays on public transit systems. The vast majority of your users are likely going to be laser-focused on a primary piece of data: which trains, buses, metros, etc are delayed right now?
With that data in mind you can start planning and building your dashboard.
The Two Sprint Approach
Your engineering team probably already works in two-week sprints, and it’s likely your product and data teams do as well. If not, we still recommend a two sprint approach to developing and launching your first Embeddable!
You could try to do it in one sprint, but what we’ve seen from working with our customers is that trying to develop the dashboard without a plan and a solid data approach can cause some headaches.
We’ve helped hundreds of folks launch dashboards, and one of the things we’ve observed is that the most successful teams dedicate significant resources for a set period of time to get their first iteration live and in front of their users. We recommend really committing during these two sprints and making Embeddable their major focus. Two to three people per sprint is usually enough, but our recommendations below will help you decide based on your team composition.

Here’s what we recommend:
Sprint 1 - Setup, Planning, Data
It should take less than an hour to get your workspace set up and connected to your data source. From there it can be tempting to jump right in (and we recommend you do so with our sample data!), but when it comes to building dashboards, knowing what you plan to build first can save a lot of time iterating. Here are the steps we recommend:
- Get everyone together who’ll be working on the dashboard for an hour. We recommend the person who’ll be setting up and managing your code repo(s), someone from your data team who’s familiar with the database structure, and whomever on your team has the best feel for what sort of information your clients are looking for. A UX designer is also a great addition - if they already have designs in Figma (or similar) it can inform decisions. If not, the decisions can inform the designs! The goal of this meeting is to identify the problems you want to solve for your clients with data visualization, and a list of data visualizations that might address those needs.
- Pick one dashboard! Focus, as mentioned above, on meeting the needs of the greatest number of clients. Plan to keep this dashboard straightforward: no more than five or, at most, ten components (and we only suggest going that high if most of them are small and easy to digest).
- Determine what data you’ll need to create that dashboard. You’ll need to know which of your tables you’ll be drawing from, and which columns are relevant to the dashboard.
- Create models to generate the data, test them in the data playground, and add datasets to your dashboard.
- Integrate the Tokens API with your application and add Security Context as needed.
- Consider the modifications you’ll want to make to the theme in order to ensure the dashboard fits the visual style of the rest of your application.
Sprint 2 - Development, Testing, Launch
Once you’ve got the dashboard planned and the data laid out, you’re in an excellent position to either turn it over to your front-end developers (if you plan to develop custom components) or whomever will be assembling the dashboard (if you intend to use our existing component set).
- Create new components or modify existing ones if necessary
- Lay out the dashboard, creating variables and interactions as needed to make things work the way you’d like them to
- Apply theming changes as needed
- Add Client Context and external variable values as needed
- Publish your dashboard to the development environment and test it on the development version of your application
- Publish to staging and then to production
- Modify your production application to display the dashboard!
Launch Early
Launching early accomplishes a lot. For one thing, it keeps the team motivated - everyone loves launches. For another, it gets your users excited. It’s an opportunity for them to try out something new and exciting. For a third, it allows you to gain crucial feedback in the form of both usage metrics and direct customer interaction.
There are two reasons that teams might encounter delays in launch timelines. First, they try to build too many dashboards before making any of them live. Second, that they focus on trying to get everything “right” before launch. While we completely understand both desires, we’d like to gently suggest they’re mistakes!
Remember, now that you’re using Embeddable for your dashboards you can iterate on what you’re showing to your customers in a matter of clicks, and any changes to dashboard layouts or data models are saved centrally and made available to everyone, so you don’t need to stress about adding work for you engineering team!

Collect Feedback
One of the best ways to keep customers engaged with your product is to help them feel like they’re a part of its design and development. No one enjoys working with an application that seems like it was created by a faceless, out-of-touch corporation that’s not listening to its customers.
If you make your customers a part of your Embeddable journey, they’ll likely reward you! Regardless of how much time you spend on a given dashboard, or how perfect you think you’ve made it, your customers are going to have thoughts. These thoughts will feel constructive to your team if they come early and often, but will feel much more critical and frustrating if they come after months of work.
This ties back in to “Launch Early” - if you do so, you can start collecting that feedback right away. In addition to avoiding frustration among your team, it’s also a great way to ensure that your dashboards are serving their purpose, which is empowering your users with data!
What’s more, you can use Embeddable’s Custom Canvas feature to enable your users to build their own dashboards right in your app, which will give them more control and a sense of ownership. The only caveat: it may be best not to start with it (see our additional tips below).
If you’re worried about collecting feedback from a large user base, an additional idea to consider is putting together a team of Power Users among your clients to whom you can make available new dashboard versions (and even new dashboards) before the rest of the client base gets them. This lets you collect feedback from clients you know and trust, who’ll likely deliver an outsized return on the small investment of setting up a dedicated communication channel or two with them.
Iterate Often
Your customer base and their needs will change. Your insights into your data will change (probably from using Embeddable!). Your data itself will change. Your visual design might even change. Don’t approach your dashboards as a static thing that you build once and then forget!
Your company is ever-growing and ever-changing. In all likelihood, so is your application. Don’t let your dashboards stagnate. Make sure they’re living entities that you work on often. This will help keep your customers engaged, because they know you’re working to make your product better. It will also deliver them more value, because you’ll be regularly adding and updating to the visual tools that allow them the insights they’re looking for.
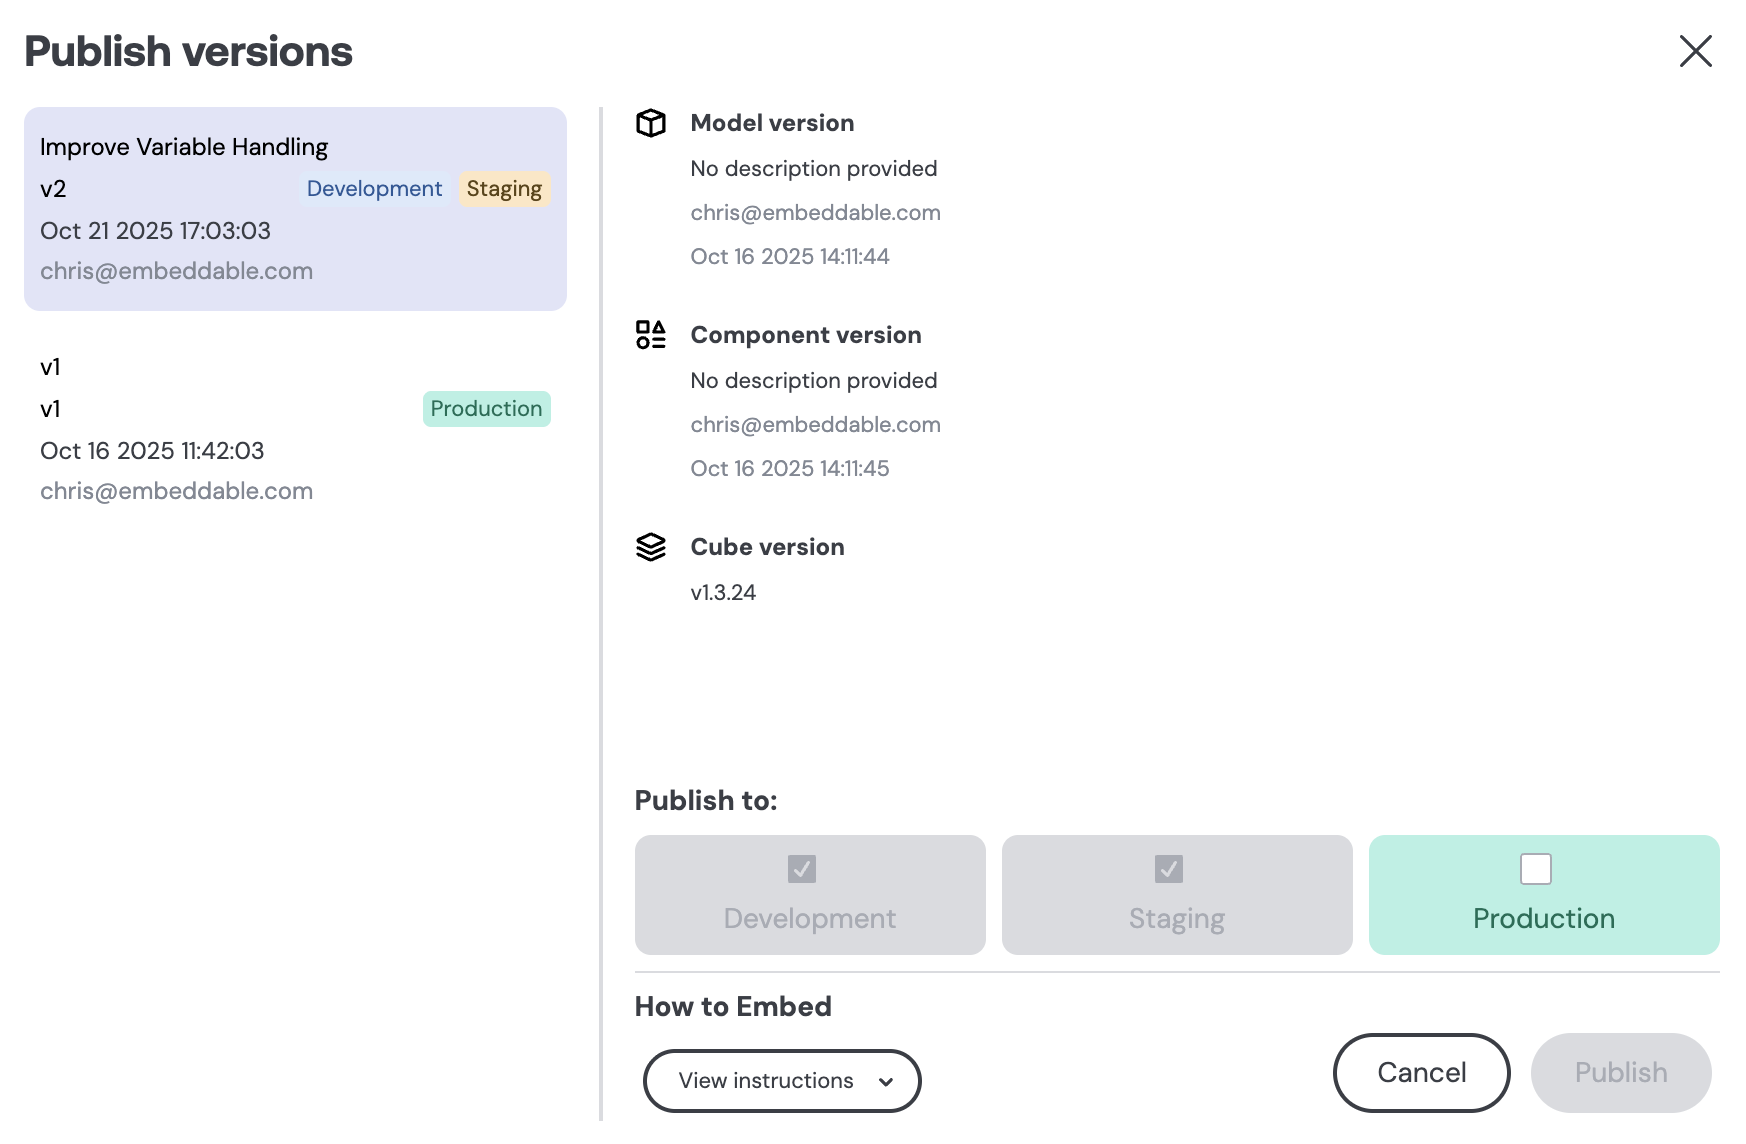
Embeddable has a wide variety of features that make iteration easy. There’s local development for testing out new or modified components. There’s the data playground for making sure your models are delivering what you need. There’s the builder itself, which saves everything you’ve done on any given dashboard but won’t make it public to your users until you publish it. Finally, there’s the multi-environment publishing system that keeps you comfortable, assured that only your fully-tested, ready-to-roll dashboards go to production.
Err Towards Simplicity
Dashboards can be overwhelming! To someone who’s spent their days in Google Analytics for the last five years, presenting a ton of information may be the right solution. For the average user? You have to keep it simple. The last thing you want is your clients to be so scared off by your dashboard that they never come back to it.
You’ll need to be balanced, of course - a dashboard that’s just a single bar chart with a KPI number next to it might be a little too simple (then again, it might not). But we definitely recommend not flooding the user with too much information. Be careful especially with tables, as they can present an overwhelming amount of information in a small space.
Think of each dashboard as a separate entity designed to tell one or, at most, a handful of stories. This will help you avoid over engineering your dashboards and make them easy, enjoyable experiences that your users will love. Let your dashboards, especially your first few, answer a question. If a user has a different question, you can easily build another dashboard or add a new chart!
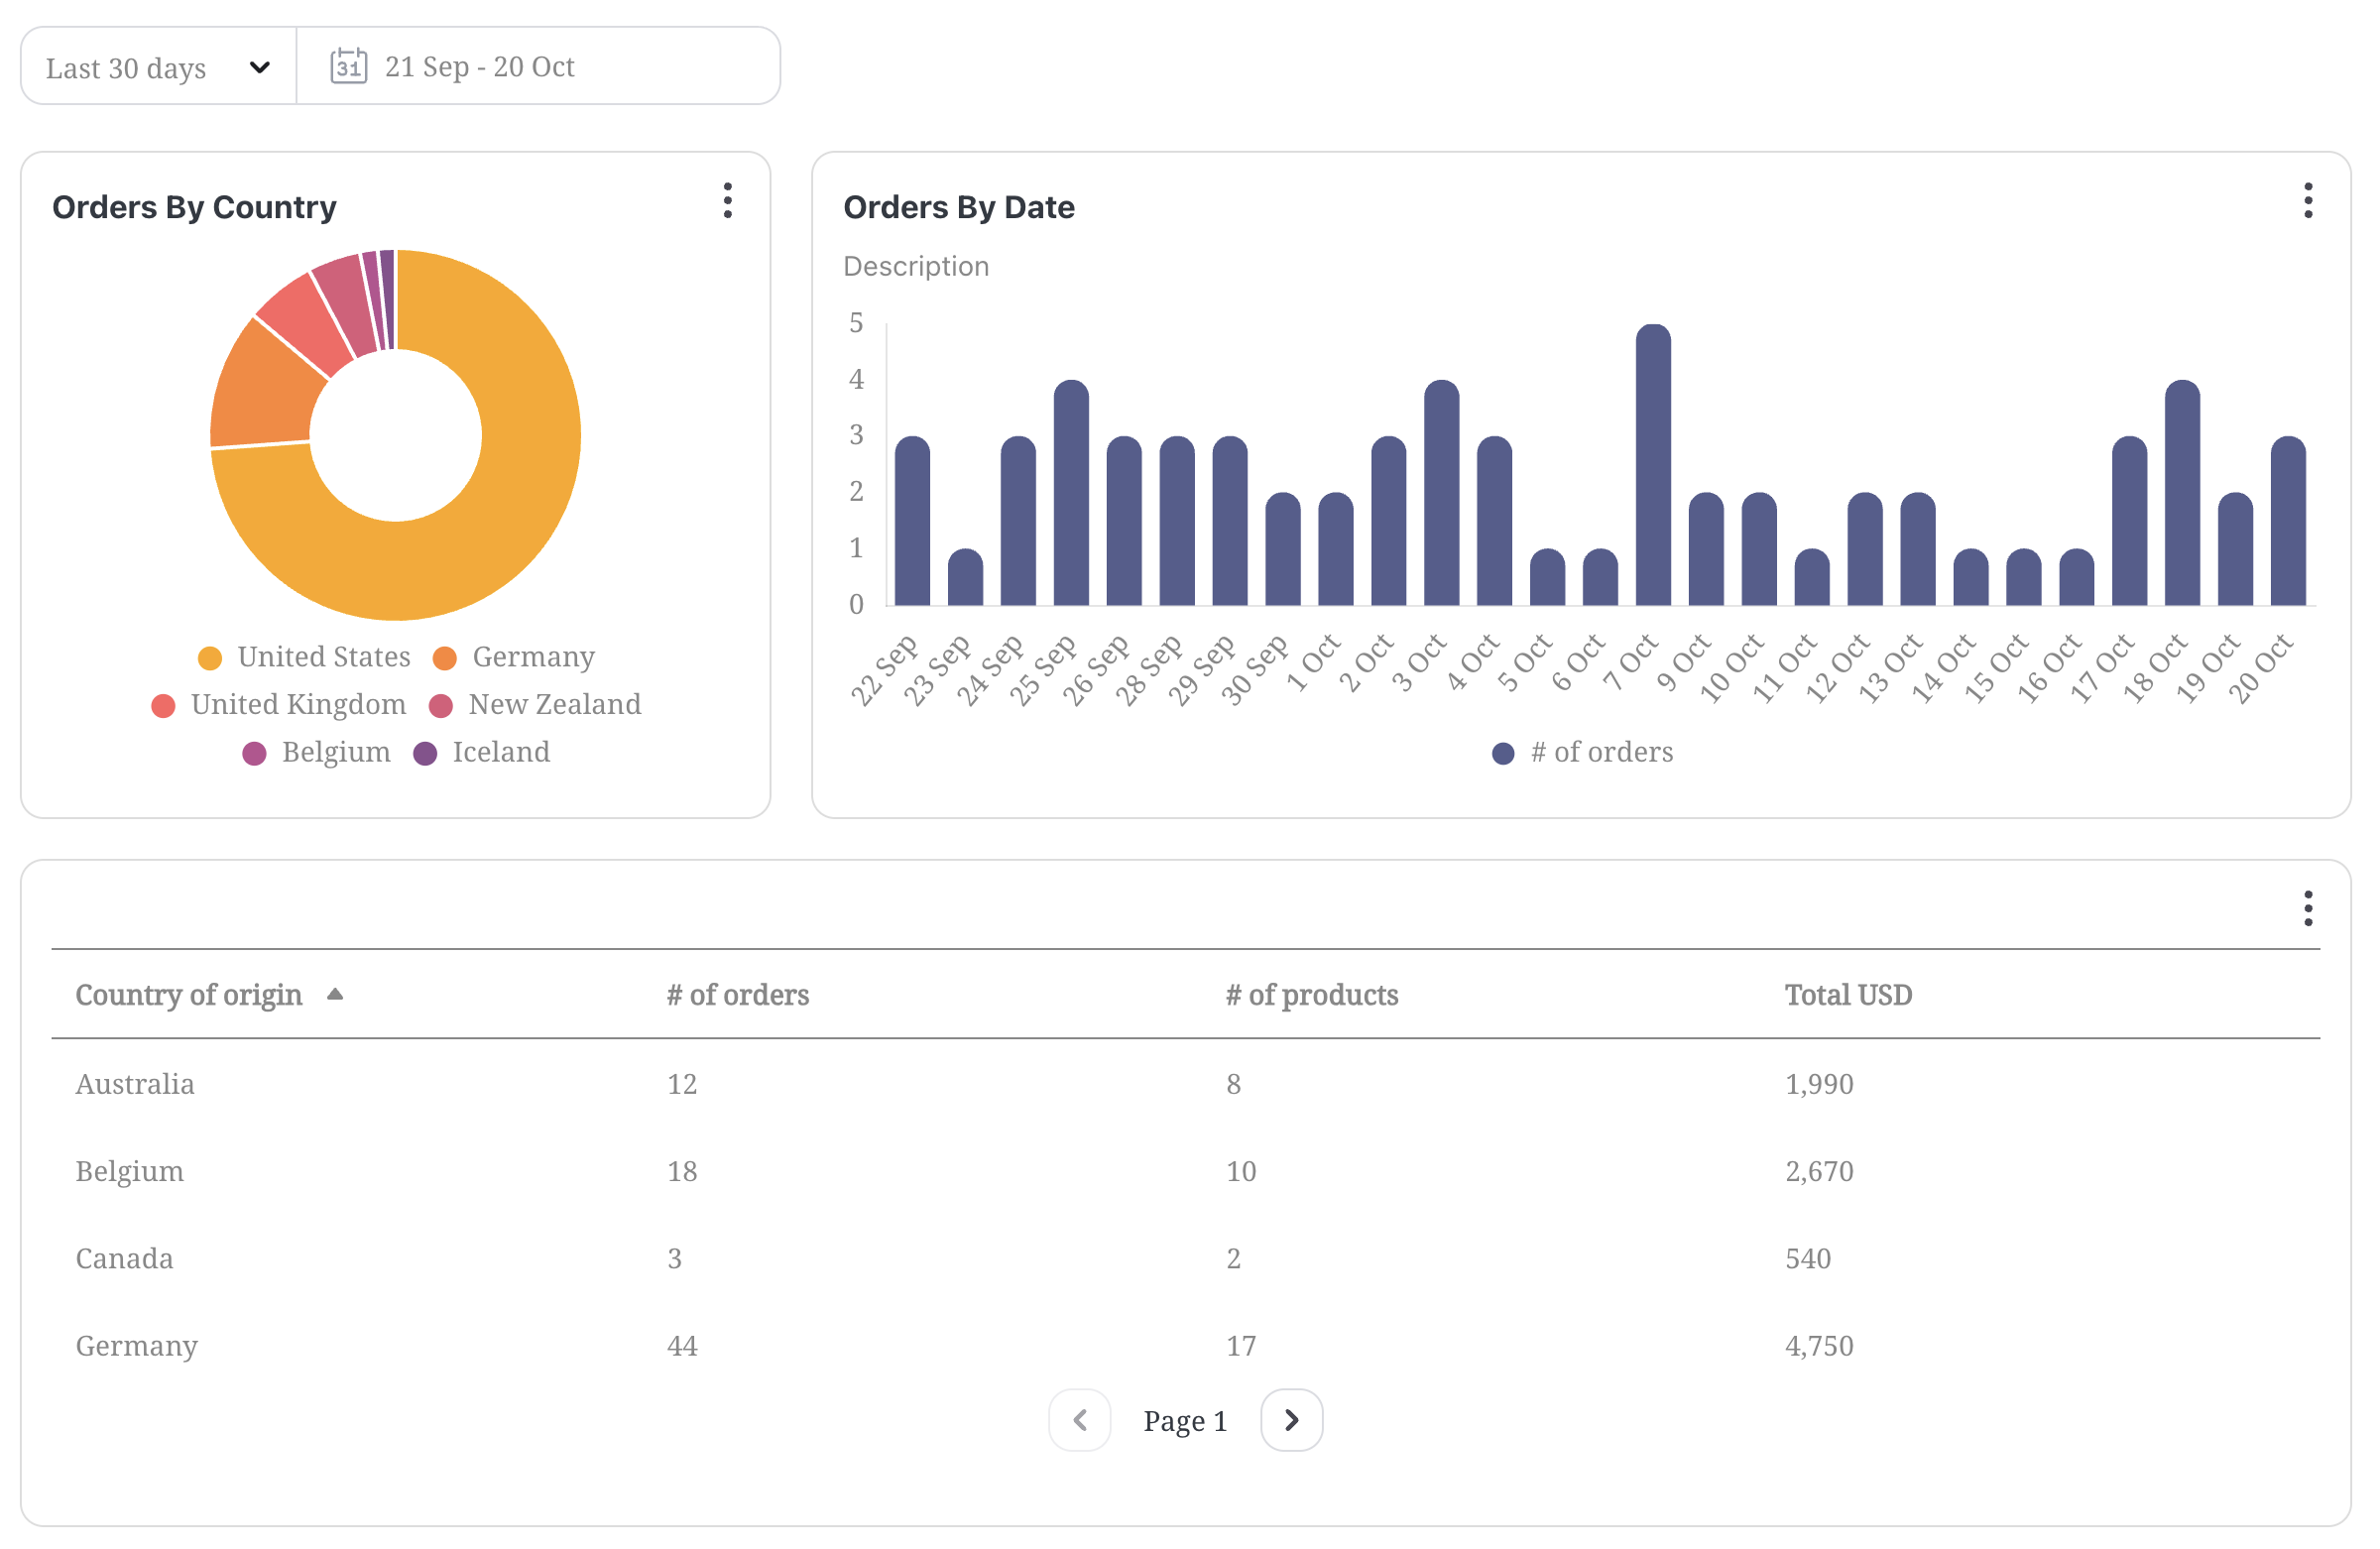
Your goal should be to answer that question succinctly but thoroughly. We find that a good mix of KPIs, charts and graphs, and table-based information is both highly compelling to users and helps break things up visually, making the entire dashboard easier to read.
Additional Tips
Here are a few quick hits that will help you early on in your dashboard development efforts!
- Name Your Variables! By default, many Embeddable components create variables automatically when added to the dashboard. This is a very handy feature, but because we can’t know what you intend to use those variables for, we give them generic names like “Dropdown Choice” and “Dropdown Choice 2” … renaming these variables to something more specific like “Country Selection” can save you a lot of confusion later.
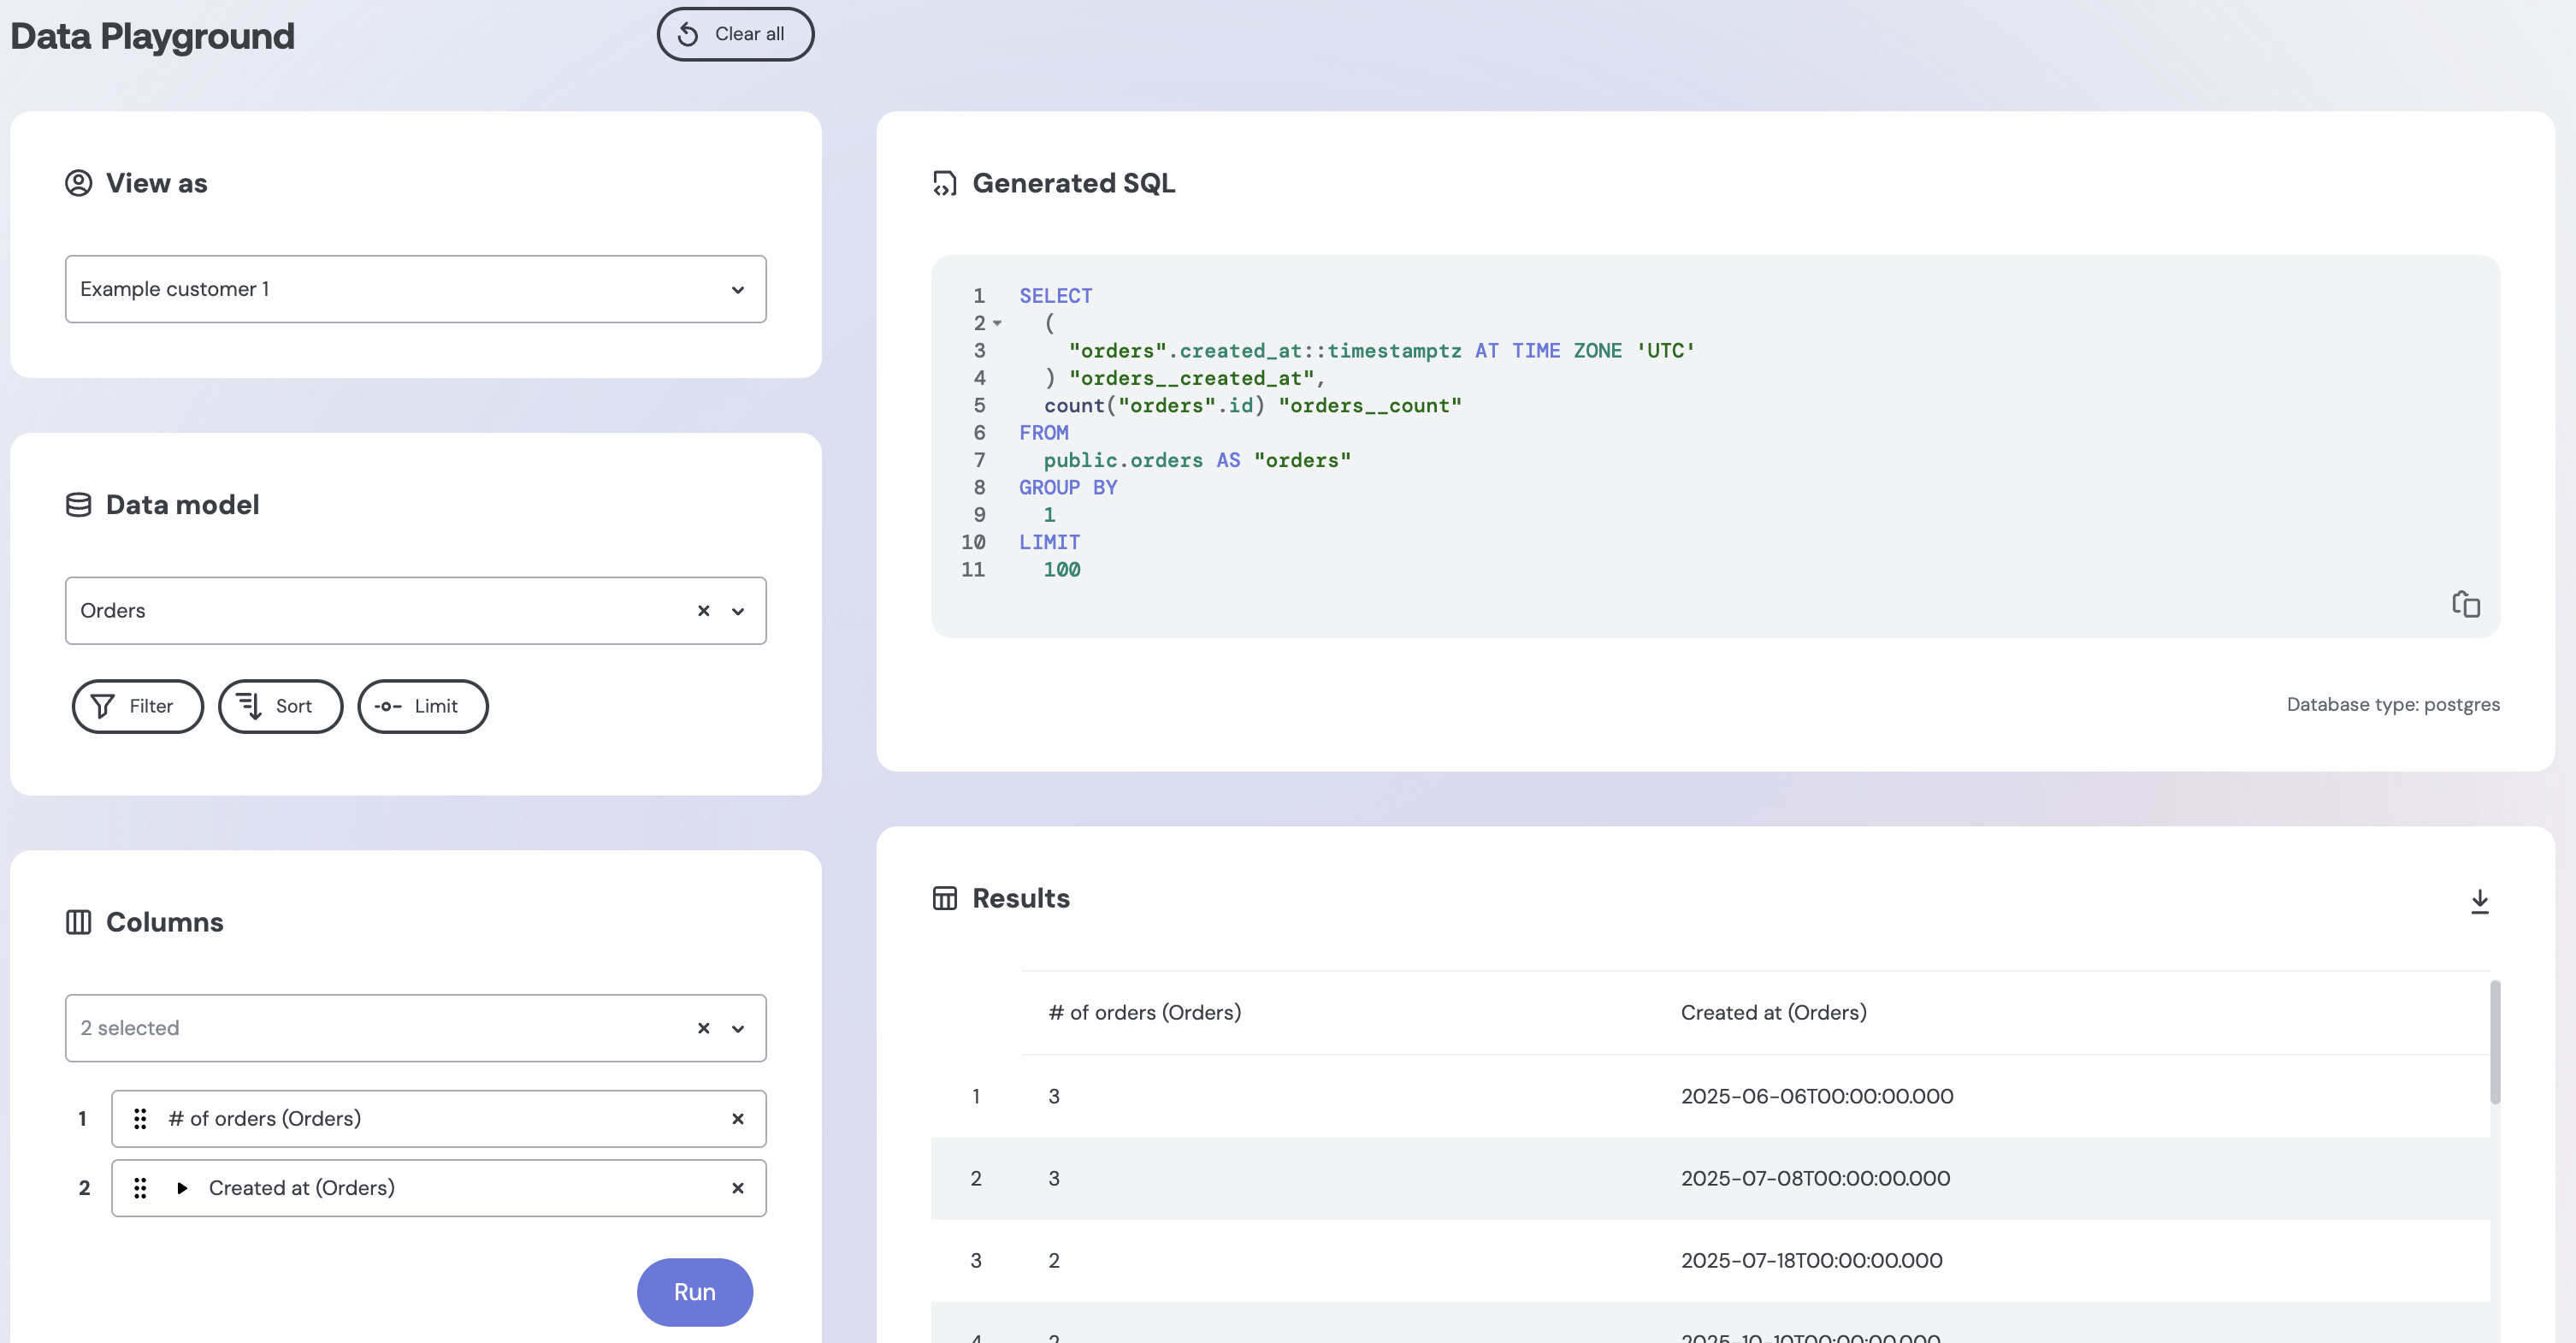
- Don’t Overlook the Data Playground! This tool (found in your workspace’s right-hand menu) is super valuable for testing out your models ahead of building your dashboard, to ensure that you’re getting the data you need before trying to make charts and graphs out of it.
- Don’t Stress About Environments! We recommend starting by just getting the default environment connected to your database to start, which only requires a single call to the Connections API. This will allow you to see your data in Embeddable immediately and start getting comfortable with the interface. You can add further environments as you become more familiar with the platform.
- Introduce Custom Canvas Later! While Embeddable’s Custom Canvas feature allows your users to create their own dashboards and really opens up the power of Embeddable, it might be beneficial for your team to start with a simple dashboard and then layer this functionality on top. We recommend holding off, at least for a bit, until your team is comfortable with Embeddable. This will allow them to quickly build Custom Canvas templates, and ensure they work well for your users.
The Wrap-Up
We’re going to take our own advice in this document and keep it short, simple, and straight to the point. If you start small and break things into two sprints, focusing on getting the dashboard out the door and collecting feedback, you’ll be in a great position. If you then iterate on the dashboard, build others with the same process, and try to keep things simple but powerful, you’ll be doing even better!
No two projects or teams are the same, an some customers have success going big right from the start. If you think that’s the right approach for you, or if you have questions about the approach we recommend, our Customer Success team can help you plan out the best possible route for your Proof of Concept.
As always, Embeddable is here to help. Whether it’s questions, problems, issues, thoughts, opinions, song lyrics, or messages you meant to send to your mother, you can be sure you’ll receive a timely response. So don’t hesitate to reach out!