Creating high-quality dashboards that are both visually appealing and insightful can be challenging, especially when you need to deliver them quickly and efficiently under tight deadlines.
Material UI (MUI) is a primarily open-source React.js component library that implements Google's Material Design guidelines. It gives developers pre-built, customizable components to create fast and beautiful web apps. Material UI comes with many great features, but also has some limitations, and may not be the best choice for large projects and complex data.
To build dashboards with MUI, you’ll be using ‘MUI X’ which includes its charts, date range pickers, and other dashboard-related components—MUI X is the charting library within the wider range of MUI component libraries.
Curious? This article will take you through the basics of Material UI, its features, and its pros and cons. You’ll also learn how to use Material UI and how to use it alongside our headless embedded analytics tool to present the charts to your customers without a huge amount of time and effort spent on engineering.
Build pixel perfect dashboards faster with Material UI and Embeddable. Learn more.
What is Material UI?
Material UI (MUI) is an open-source component library for building UIs in React applications, based on Google’s Material Design guidelines.
MUI provides various pre-built, fully customizable UI components like buttons, grids, forms, and navigation bars, all styled to follow the Material Design philosophy.
Premium, paid versions are available, and include additional templates, components, and support options. Most users prefer to stick to the free version, though, as it is already feature-rich, flexible, easy to use, and has robust documentation.
Material UI also has a notable extension called MUI X, which will be more beneficial for charting, as it offers advanced components specifically designed for handling complex data and improving productivity in applications. Examples include DataGrid, which helps display, sort, and filter large datasets, and Date Pickers, which helps select data and time ranges with advanced configuration options.
Key features
Material UI comes with several key features that will help you with your projects.
- Component library. Material UI offers a massive library of components, from basic UI elements (buttons, sliders, text fields) to more complex layout tools (grids, cards, and tabs).
- Customizability. You can easily customize components to match your project’s theme, including colors, typography, and layout. Theming is a key feature that makes MUI stand out.
- Responsive Design. Built-in tools allow you to make your app responsive across devices, without having to write complex CSS rules yourself.
- Built on React. Since Material UI is built on React, it naturally fits into the ecosystem and development workflow of teams already using this modern JavaScript-based frontend language.
What charts can you build?
Material UI has a very broad range of components, however its’ charting components are relatively new so the breadth of choice may be limiting in some cases. That being said, MUI share on their public roadmap that there are more charts being developed, so, depending on when you’re reading this, the library may have everything you need!
Here are some of the chart types you can easily create with Material UI:
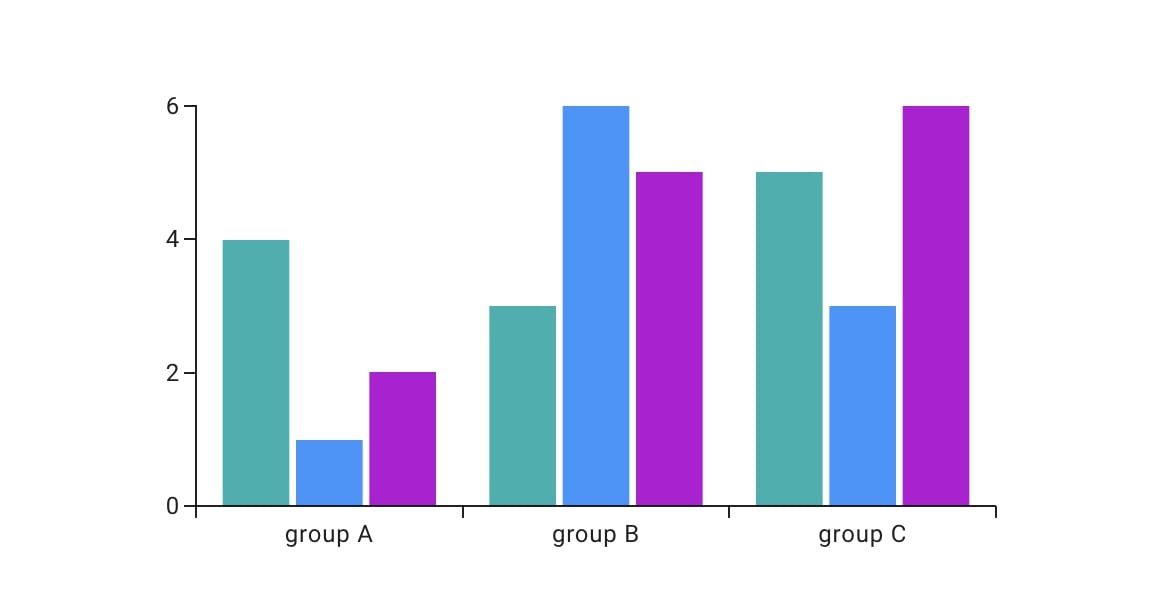
- Bar charts. Useful for comparing categories of data, such as monthly sales or revenue by product. The length of each bar corresponds to the data it represents, making it easy to compare values at a glance.

- Line charts. Ideal for visualizing trends over time, like stock prices or user activity.
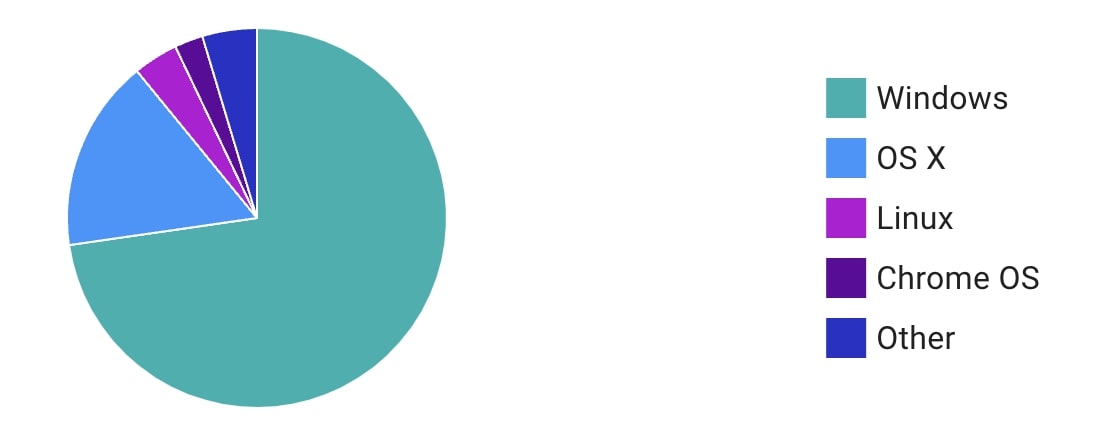
- Pie charts. Best for representing proportions or percentage breakdowns of a whole, such as market share. In the example below, the chart shows the distribution of users by operating system.

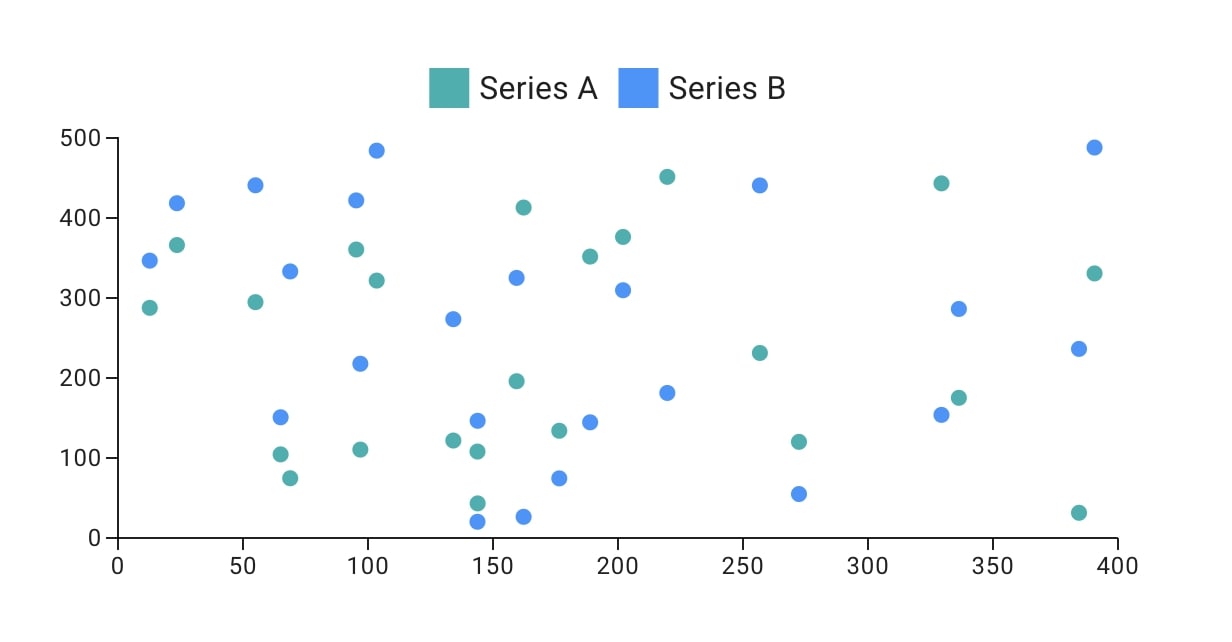
- Scatter plots. Great for showing relationships between two variables. Below is an example of a scatter plot from MUI. It highlights the relationship between two sets of data—series A and series B.

- Area charts. Similar to line charts, you’ll often need them to display cumulative totals.
- Heatmaps. Useful for showing data density or activity over time, often used for analyzing user behavior on websites or apps.
Pro tip: MUI X, an extension of MUI, comes with additional advanced components, including DataGrid (for handling complex data tables), Date Pickers, and other premium features. It relies on D3.js for data manipulation and provides 3 levels of customization: single components, extensive configuration props, and subcomponents for flexible composition.
What frontend frameworks can you use with Material UI?
Material UI will almost always go hand in hand with React due to the latter’s widespread use in web development. That’s why you’ll often find MUI integrated into a variety of front-end frameworks and libraries that support React.
The most common frameworks you can use with Material UI include:
- React (base library). MUI is built specifically for React, so it’s the natural first choice for integration.
- Next.js. If you’re building server-side rendered applications or static websites, Next.js pairs beautifully with MUI.
- Gatsby. If you’re trying to build a website that loads at an amazing speed, Gatsby is an ideal framework, and you can rely on Material UI to provide the UI components and styling.
- Vite. Known for its fast development experience, Vite works well with MUI for projects that need instant feedback and fast build times.
- Create React App. This is the go-to starting point for most React projects, and MUI fits in seamlessly here, allowing you to quickly create an app and add UI components.
- React Native. While Material UI is not directly compatible with React Native (since React Native uses native mobile components), you can still use similar UI libraries like React Native Paper or React Native Elements for a MUI feel in mobile apps.
What do users say about Material UI?
Material UI has garnered a strong reputation among developers for its ease of use, flexibility, and professional design. We’ve analyzed a lot of user reviews and found people love the following:
- Ease of use. Many users emphasize how quickly they can build polished interfaces with MUI. "It feels like you get professional-looking UIs out of the box without having to be a designer," one Reddit developer said.
- Customizability. The library's customization options are another standout feature. "Material UI is easy to implement and integrate with React. It has very precisely built modern UI components that are easy to use in ongoing projects without designing. It gives the ability to customize the components with CSS properties," shared a user on G2.
- Documentation. MUI’s extensive documentation, tutorials, and examples make it easy for both beginners and experienced developers to use effectively.
Most users have great things to say about Material UI, but a few found that it just wasn’t the right fit for their specific needs. For instance, one user on Reddit stated, “Material UI adds a lot of code to every component and a layer of indirection that we didn't like. So, we ended up stripping Material UI, and this ended up being the right choice for us.”
Some also dislike that anything you design using MUI will have an almost standard look, similar to everything designed by Google and Android. You can see that’s true from the examples above.
If you want to give your designs a unique feel, you'll either have to do a lot of customization or consider alternatives like Tailwind CSS, which some users say offers much more flexibility for creating fully custom designs from scratch.
How to use Material UI X Charts
Everyone talks about how easy it is to use Material UI. But what are the exact steps you must take? Here, we’ll explore each of them, from installation to building and customizing your dashboard components.
1. Installing Material UI and MUI X Charts
The first step is to install Material UI in your React project. You’ll need the core package and the styling engine, along with the charts package:
npm install @mui/material @emotion/react @emotion/styled @mui/x-charts
This command installs the necessary packages for Material UI components and the charts library.
2. Set up the Material UI theme
One of MUI’s key features is its robust theming system, which allows you to create a consistent look across your entire application.
During this step, you’ll define things like your color palette (for primary and secondary colors), typography (font styles, sizes, etc.), and layout (spacing between elements).
3. Add dashboard components
Once you’ve set up the basic styles using the theme, you can start adding actual components to your dashboard. MUI provides various pre-built components, like grids, cards, buttons, and forms.
The grid system allows you to define responsive layouts that automatically adjust depending on the screen size. Cards will be useful if you want to display individual pieces of information or widgets in a structured format.
Last but not least, you can also add other components, such as drowdowns, buttons, or input fields, to make the dashboard interactive.
4. Next steps
After getting your basic dashboard up and running, there are several next steps you can take to further enhance functionality.
- Integrate a backend API. Connect your charts to live data from a database or API, allowing them to update in real time.
- Enable interactivity. Add features like zooming, filtering, or tooltips to make your dashboard more user-friendly.
- Add export functionality. Allow users to export charts or entire dashboards as PDFs or image files.
- Schedule reports. Set up a system to generate and send reports automatically based on dashboard data.
If you’re creating a complex dashboard and want to navigate between different views or pages, you can use React Router, a popular library for handling routing in React apps.
React Router works great with Material UI components like buttons and navigation bars and helps you create a smooth navigation experience in your web application.
Summary: More than meets the eye
Despite MIU X Charts making it a lot easier to get to a place where you have some beautifully-styled bar, line and pie charts to use in your dashboards; that’s only the tip of the iceberg. You’ll also need to ensure that the interactions are set up, the data loads fast, the data is modeled in a way that users understand it, implement monitoring and testing etc.
Ultimately the engineering work needed to create a truly remarkable end-user experience is still significant, even if you use a React charting library like MUI.
What if there was a better way? Introducing Headless Embedded Analytics
Building dashboards with MUI gives you a lot of control and flexibility. However, once you start incorporating real-time data connections, enabling user interactions, and optimizing performance, it can quickly become overwhelming.
All these extra steps can slow down development and require significant effort to maintain. That’s where headless embedded analytics from Embeddable comes in to simplify things and help keep your projects on track.
With Embeddable, you can offload a lot of the complexities involved in managing data infrastructure. But, you keep full control over the user interface.
It simplifies data handling and dashboard management, allowing you to focus on the user experience without getting bogged down by backend challenges and constant reliance on engineers for updates.
Here’s why you should know about headless embedded analytics:
- Complete control over UI/UX. Maintain full design and branding control over your dashboards. You decide how everything looks and behaves, ensuring a seamless, native experience for your users.
- No backend hassles. Eliminate the complexity of managing and maintaining backend systems, caching, and data processing. Embeddable takes care of these infrastructure challenges, so you can focus on building the front-end experience.
- Faster time to market. By handling the backend processes for you, Embeddable speeds up your development, so you can deliver powerful dashboards in a fraction of the time.
- Scalable and flexible. Easily scale as your user base or data volume grows. Embeddable’s architecture can handle large datasets and increasing demands with minimal effort on your part.
- Optimized performance. No more worrying about slow loading times or performance issues as datasets grow larger. Embeddable optimizes performance, helping you create fast, responsive dashboards.
- Advanced Features Included. Easily allow your users to craft their own dashboards, export in different formats, filter data, or set up custom reports - with no heavy lifting on your side.
How to use Material UI with Embeddable
Material UI can be a good choice when building dashboards, thanks to its pre-built components, responsive design, and adherence to Material Design principles.
This will give you to frontend experience, but there's still a lot of work to so. Embeddable offers easy-to-use embedded analytics that you can use alongside MUI for more powerful results. Here’s how you can do that:
1. Define your charts in MUI
Use the steps above to import the Material UI charting library into your repo, and start to configure and customise the look and feel of the charts you want to use in Embeddable.
2. Apply mapping to Embeddable
Using the
defineComponentfunction, you can map the props in your chart to inputs in Embeddable, this will allow you to modify the inputs to these props in the GUI ‘no code builder’ provided by Embeddable. These inputs might be things like metrics, dimensions, a chart title, color scheme, or anything else you might want to decide in the builder vs. at code level.
Further details can be found in Embeddable’s docs.
3. Push your charts to Embeddable
After setting up your charts, simply wrap them with Embeddable's SDK and send them to the no-code builder dashboard. Once there, they’ll be organized as reusable chart components, allowing you to create limitless dashboard variations using an intuitive, point-and-click interface.
4. Configure dashboards
Embeddable lets you set up dashboards, create interactions between charts, and control how data appears in a no-code ‘point-and-click’ interface. You can create as many dashboards as you need and easily enable features like exporting, and allowing your end users to build and build their own dashboard views from within your own application.
5. Embed with a web component
Lastly, embed the entire dashboard directly into your frontend app with Embeddable’s simple, secure web component. Just follow the documentation to integrate it with a few lines of code, creating a seamless, native experience for end users, as the charts load directly in your DOM—no iframes required!
In Summary:
In a sentence: using MUI X Charts with Embeddable allows you and your team to create highly performant and native-feeling dashboards, fast.
While the charts in Material UI give you a head start on the frontend, Embeddable allows you to make use of those charts in an easily-manageable embedded solution that ensures you have fast-loading and engaging interactive dashboards with minimal engineering effort.
Material UI: Is it right for you?
Material UI is a good choice for developers who need a reliable, flexible, and visually appealing UI framework for React applications. It isn’t perfect, but combined with other tools, such as Embeddable’s headless embedded analytics, you can get the results you want.
On the plus side, Material UI provides a vast selection of ready-to-use components that make building UIs fast and efficient. It has a powerful theming system with which you can customize your designs. Plus, it is focused on React, so it will fit in with your workflow easily.
However, customizations are somewhat limited, with many complaining all Material UI applications look the same. You may change some fonts, colors, and typography, but there will be a certain look that will be similar to other Material UI apps.
For large applications, managing MUI’s styles and components can sometimes impact performance.
If you’re looking for a way to streamline your dashboard development even further, integrating MUI with headless embedded analytics via platforms like Embeddable is an ideal solution.
You get the best of both worlds: full control over the front end and a powerful analytics backend to handle complex data processing and interaction.
Build pixel perfect dashboards faster with Material UI and Embeddable. Learn more.
Frequently asked questions about Material UI
Why is Material UI so popular?
Material UI’s popularity stems from its adherence to Google’s Material Design guidelines, its extensive component library, and how it can be easily integrated into React applications. Developers appreciate the polished, professional look they can achieve with minimal effort, along with the deep customization options.
Is Material UI easy to learn?
Yes, Material UI is relatively easy to learn, especially if you already have experience with React. The documentation is clear, and the component-based nature of React makes it intuitive to pick up. Even if you're new to web development, Material UI provides many examples and guides to help you get started.
Is Material UI good for big projects?
You can use Material UI for large projects thanks to its scalability and customization options. However, there’s a risk that the many styles and components will affect performance, which is why most prefer MUI for small and medium-sized projects.
What’s better than Material UI?
While Material UI is an excellent choice for building clean, responsive interfaces in React, it has limitations when it comes to handling complex data-driven applications, especially when you need advanced analytics and real-time data. In these cases, a library like Tailwind CSS combined with other charting libraries might be more suitable.


.jpg)


