Looker vs Sisense: Embedded Analytics Comparison
We compare Looker and Sisense across features, pricing, visualization capabilities, embedding and more, from a developer's perspective.
Summarize with:
On the face of it, Looker and Sisense are very similar tools. Both are built for enterprise audiences, and they're known for their reliable data analysis capabilities. But when it comes to embedded analytics, neither is an excellent choice. A good choice, perhaps.
Looker and Sisense are BI tools for data teams first, and embedded analytics tools for developers and product teams second. This means that in embedded environments, much of the look and feel of both tools remains the same.
Today, we look at Looker Embedded vs Sisense across their features, visualizations, and pricing to tell you which tool is better for embedded analytics.
Looker Embedded and Sisense at a glance
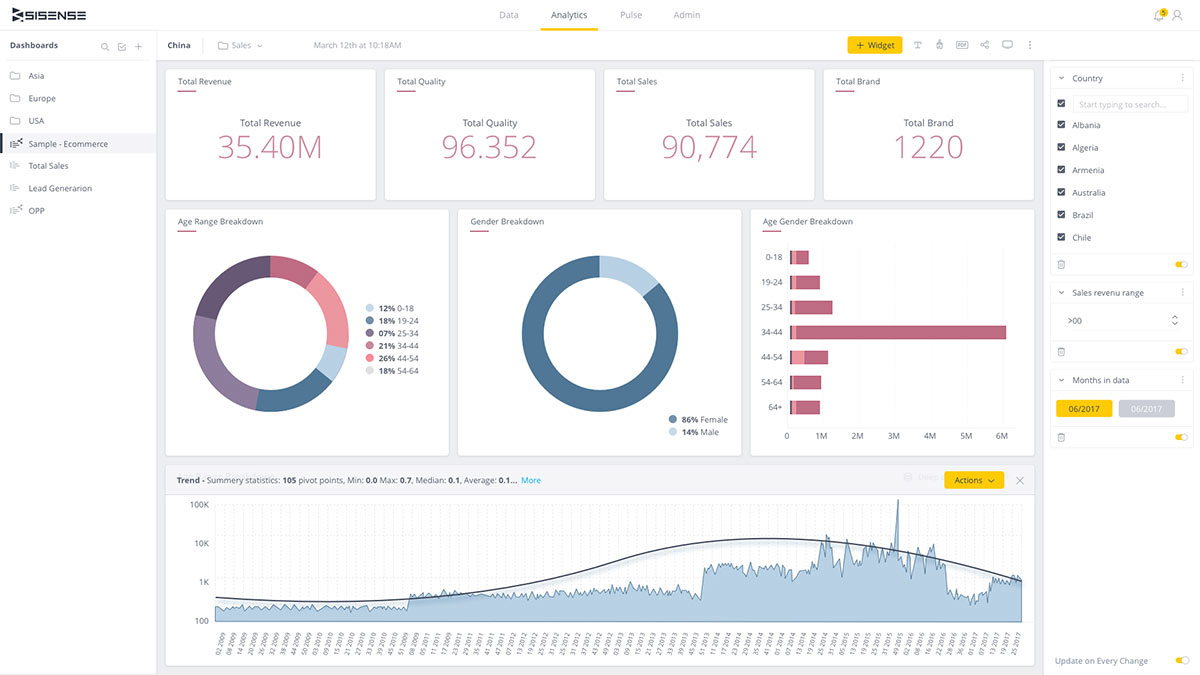
Sisense is an end-to-end analytics platform founded in Israel in 2004 that pivoted to focus on embedded use cases in recent years. It began as an internal BI solution and still carries traits of a BI tool even as it targets embedded analytics.
For example, Sisense provides a full-stack analytics environment (including its own in-memory data engine, ElastiCube) and rich BI features. This makes it powerful, but also means embedding Sisense can feel like embedding an entire BI application into your product.
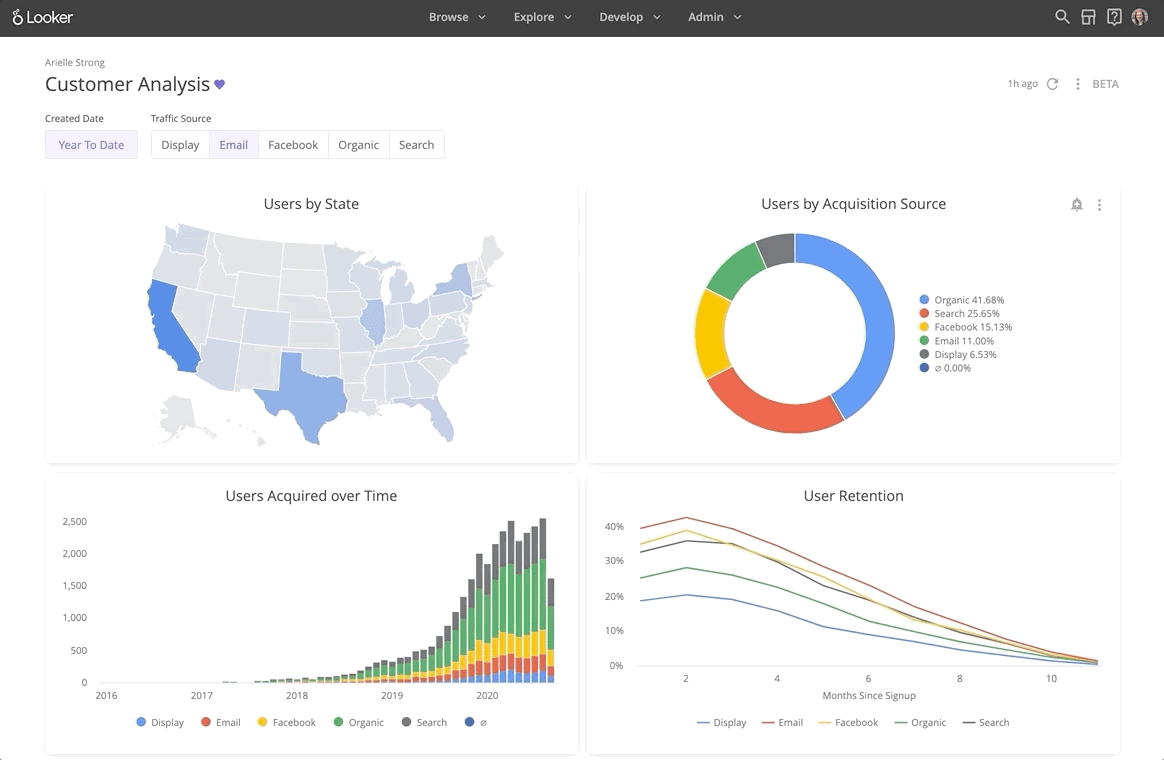
Looker (now part of Google Cloud) is likewise an enterprise BI tool at its core. It pioneered a data modeling language (LookML) for data governance and consistency, which brought it a lot of credit in the data community.
Looker was designed to let data teams define a single source of truth and build internal dashboards.
Regarding embedding, Looker provides options to integrate those same dashboards into external applications, but the experience is still largely that of embedding Looker’s BI interface. Embedded Looker content is served through secure iframes with a Looker login or token.
| Sisense | Looker | Embeddable | |
|---|---|---|---|
| Core origin | Traditional BI tool with embedded added later | Traditional BI tool with embedded added later | Built for embedded analytics from the start |
| Embedding method | Iframes, Embed SDK, JS SDK (Sisense JS), Compose SDK (headless) | Primarily iframe with signed URLs, Embed SDK (iframe management) | Embed as a web-component, or native React/Vue for native feeling embed |
| UI customization | Moderate via themes and branding; deep customization is possible with BloX or Compose SDK but requires developers | Limited. Some theming (colors, logo removal), but layout and UI are fixed inside iframe and will feel like Looker in your app | Headless SDK, allowing unlimited extension and modification of charts, or import of any React component (i.e. from your favourite charting library) |
| Visualization options | Standard set of charts; extendable via plugins and BloX for custom visuals | Core set of ~15-20 standard charts; limited customization unless custom visuals are developed via JS | Unlimited. Bring your own chart libraries (apply your own design system), fully flexible |
| Data sources | All major databases and data warehouses | All major databases and data warehouse; relies on external pipelines for SaaS or file-based data | All major databases and data warehouse |
| Deployment model | Cloud-hosted or self-hosted options | Fully cloud (Google Cloud) | Cloud-native with option to self host semantic layer. |
| Authentication integration | Supports SSO, tokens, custom authentication flows. Requires user mapping in Sisense. | Google OAuth, SSO, token-based iframe auth. Requires user mapping in Looker. | Fully programmable access control via API for multi-tenant and customer-specific data delivery. No user mapping required. |
| Pricing model | On request. Enterprise licensing; opaque pricing; minimum ~$10k/year, often $60k–100k+ for embedded | On request. Enterprise licensing; opaque pricing; embedded pricing often starts ~$120k/year | On request. All plans include unlimited users, viewers and dashboards. |
| Performance (embedding) | Can suffer from heavy resource usage depending on data throughput and embedding method. Requires Enterprise plan for performance features. | Generally stable performance for Enterprise, but not in Looker Studio; iframe model adds overhead. | Extremely fast (sub-second loads), lightweight embedding and caching layers designed for SaaS scale |
| Developer experience | Strong developer tools (if you use Compose SDK); but complexity is high | Dev-heavy due to LookML, auth workarounds, and rigid modeling; simpler iframe embed if limited customization | Developer-first, clean APIs, React SDK, modern architecture for fast integration |
Looker vs Sisense - embedding methods
For developers who want to provide actionable insights to end-users, the most important question is how the tool embeds into an app. Both tools offer various methods for embedding dashboards.
Sisense embedding methods
Sisense offers several embedding methods, depending on your technical know-how and the amount of customization you need.
Iframe Embed
This is the simplest approach – drop a Sisense dashboard into your app using an HTML <iframe> tag. This displays the entire Sisense interface (or a specific dashboard) within your product.
It’s quick to set up but essentially shows a “window” to Sisense, which means you get the full Sisense UI (menus, etc.) unless you add URL parameters to hide certain elements.
You’ll need to define your users in Sisense and then make a call to filter the dashboard data to show the data that the user should see. It’s also the slowest option since it loads the whole web app each time.
Embed SDK
Sisense provides a JavaScript SDK that wraps the iframe method with APIs for finer control. The Embed SDK lets you apply filters, respond to user interactions, or refresh data from your host app.
It still uses an iframe under the hood but gives you programmatic data management of that embedded content (e.g., listening for events, removing Sisense chrome, etc.). This gives a somewhat more integrated feel, though the customization remains limited, and loading speed is still affected by the iframe container.
Sisense JS (JavaScript API)
Sisense provides a JS library for deeper integration, allowing you to embed individual widgets (charts, filters) without iframes. Essentially, your app can load Sisense components directly into its DOM.
This gives much more control over styling and layout, and you could intermix Sisense charts with your own HTML elements for a truly blended UI. The trade-off is complexity: using Sisense JS requires significant coding and understanding of Sisense’s internal objects.
It’s powerful (you can even embed just parts of a dashboard or build new visualizations on the fly), but it's meant for developers.
Compose SDK
The newest option, Sisense’s Compose SDK, is a collection of client-side libraries for a “composable” analytics experience. It’s aimed at modern web developers (supporting React/TypeScript) to generate analytics in your app programmatically. With Compose, you can query data via Sisense, then render it using either Sisense’s components or your own UI components.
This is the most flexible and developer-centric approach – essentially using Sisense as a headless engine. It avoids iframes entirely. The downside is that it’s code-driven and currently limited to certain frameworks, so your team needs to be comfortable writing JavaScript/React code to build the analytics experience.
Looker Embedded
Looker’s embedding model is a bit more straightforward (and restrictive). The primary way to embed Looker content is via iframes with signed URLs.
In practice, you create a Looker dashboard (or visualization) in the Looker UI, then generate an embed URL. This URL is “signed” with a secret key and user-specific details, which allows Looker to display the content externally with proper authentication. Your application then loads this URL in an iframe.
Looker supports a few variations of this theme:
- Private embedding (the user must log into Looker),
- Public embedding (no login required, for non-sensitive data), and
- Signed embedding (the recommended approach for embedding in multi-tenant apps, where the iframe is pre-authenticated via the signed URL
All of these still involve iframes.
To simplify developers' lives, Looker provides an Embed SDK (JavaScript library), which is similar conceptually to Sisense’s Embed SDK. The Looker Embed SDK helps manage iframe creation and communication. For example, it allows your host app to listen for events from the embedded content and to programmatically navigate or set filters without reloading the iframe.
It abstracts some postMessage calls and helps keep the embedded iframe in sync with your app’s state. The Embed SDK does not remove the iframe, but it at least means you can embed once and then dynamically load different dashboards or explores into that same container without constantly reloading pages. This improves the user experience and performance of embedding multiple views.
However, unlike Sisense, Looker does not allow you to pluck out individual chart widgets to embed directly in your own HTML.
The content inside the iframe is a full Looker dashboard or visualization. You can apply some light theming or parameter tweaks (for instance, hide certain Looker UI elements via URL params, or use Looker’s theme options to match your branding), but you cannot use your own custom components or break a dashboard apart and embed pieces natively.
In short, Looker’s embedding is iframe-centric – a secure and controlled approach, but less flexible for deep customization, and provides a sub-standard end user experience. This can feel restrictive for highly interactive use cases.
The level of customization
Embedded dashboards should feel like a natural extension of your product, not another app loading inside a separate window.. Here we compare how much you can customize and white-label Sisense and Looker in embedded scenarios.
Sisense
Sisense provides basic white-labeling and theming options out of the box for your reports and dashboards.
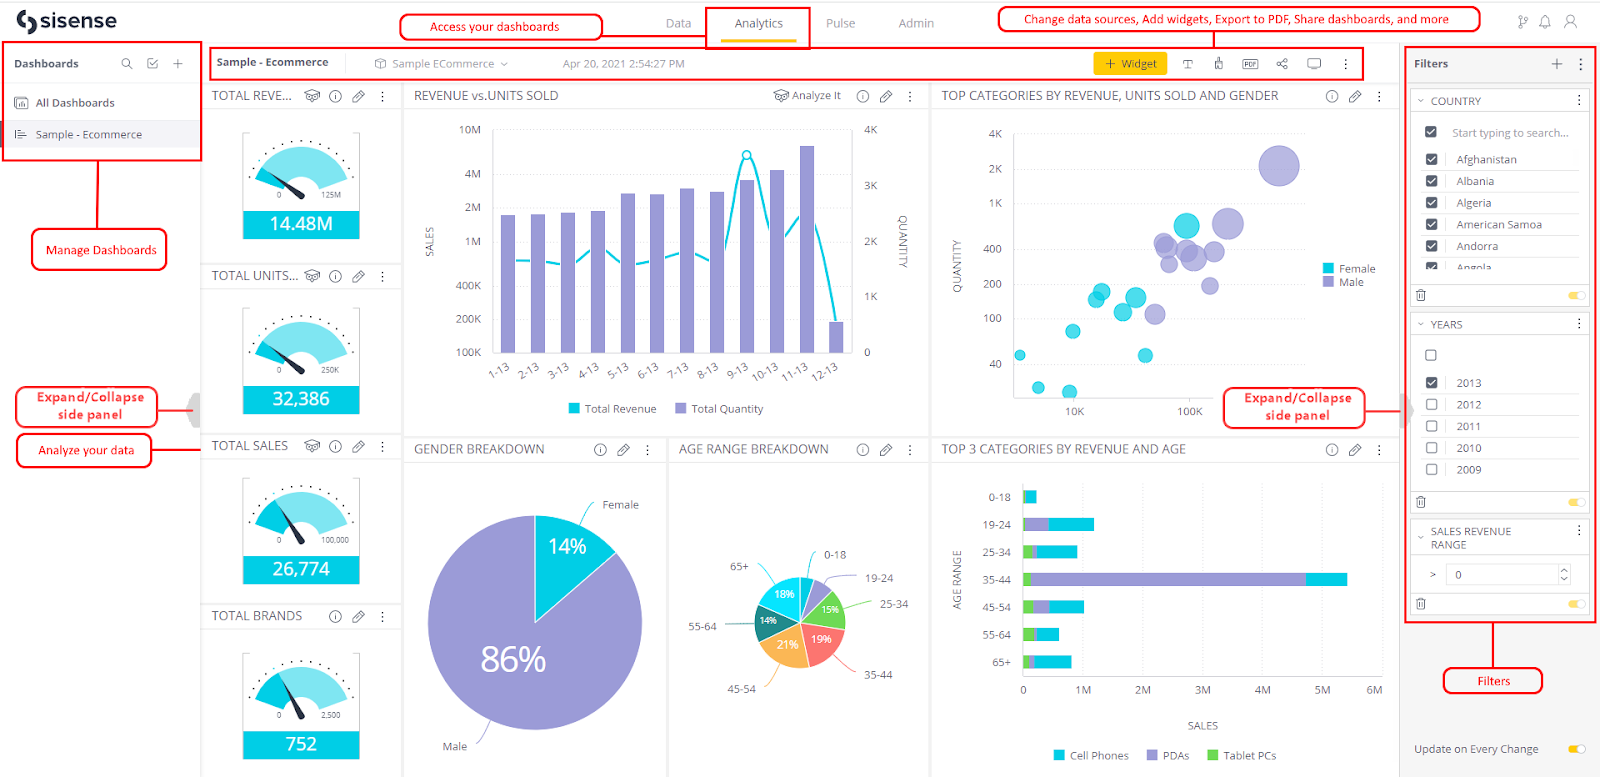
For instance, you can remove Sisense branding, apply your logo, and adjust chart color themes to align with your brand. However, beyond surface-level theming, Sisense’s customization is constrained by its internal BI heritage - customization of the UI is simply not important for internal BI.
Because Sisense was initially built as a standalone business intelligence tool, many aspects of its UI and workflow are fixed. Embedded Sisense dashboards typically retain the Sisense layout of filters, menus, and widgets, which might not perfectly match your app’s UX.
To address some of this, Sisense introduced add-ons like Sisense BloX, which allow developers to create custom visualizations and widget layouts using JSON and scripting. With BloX, one can design entirely custom dashboard elements (e.g., text, images, buttons combined with data) for a more bespoke analytic app experience.
The trade-off is complexity: BloX is powerful but difficult to implement (as users note, it “gives the ability to manipulate functionality and look/feel” but is complex and under-documented). In other words, the capability for deep customization exists, but it requires significant coding and expertise.
When using Sisense’s JavaScript embedding (Sisense JS or Compose SDK), you gain a lot more control. You can inject CSS to style embedded charts or rearrange elements on the page. It's not a fit for non technical users, but you open a world of possibilities.
With developer effort, Sisense can be made to look quite native in your application – you could build your own container around Sisense visualizations, for example, controlling menus and navigation outside of Sisense.
With Sisense's API, widget-level customization and even drag-and-drop dashboard assembly are possible. These approaches effectively treat Sisense as an engine and let you craft the front-end UI, achieving a highly custom feel.
However, it must be stressed that these advanced customizations aren’t point-and-click – they are projects in themselves.
Many teams find that Sisense’s customization options are limited to the basics without dedicated developers. If you embed via iframe or the standard dashboard UI, you are limited to hiding the Sisense toolbar, applying a theme, and perhaps some minor layout tweaks via URL parameters. The core interactions (filter panels, drill-down behaviors, etc.) will work as Sisense designed them.
Looker Embedded
Looker takes a more uniform approach. Customization in Looker embedded analytics is relatively limited.
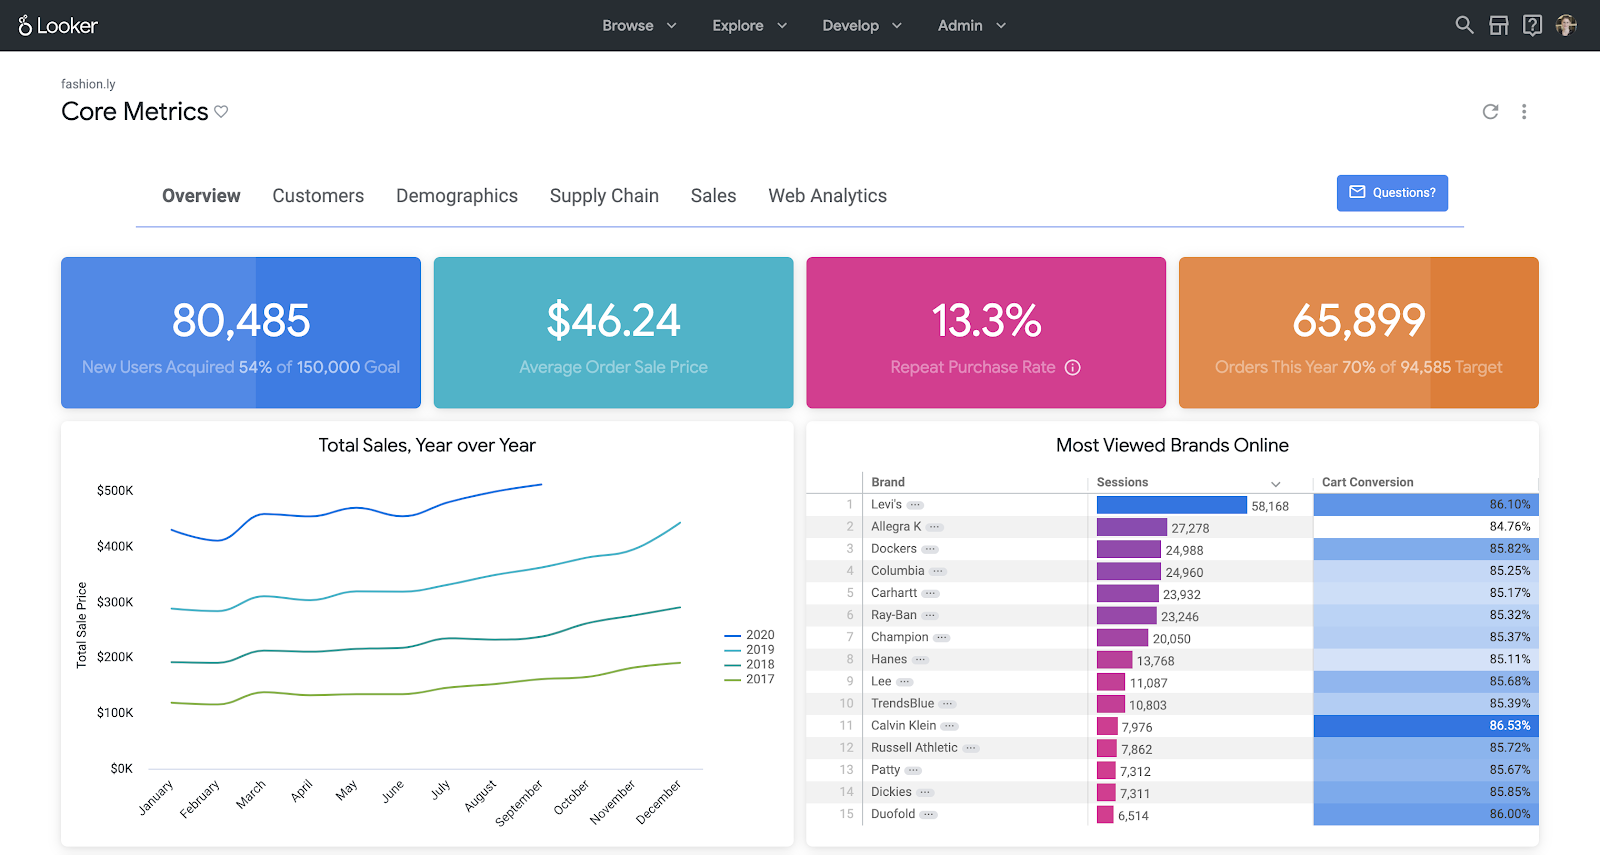
The platform offers theming capabilities. For instance, you can define color palettes, set chart styles, and customize certain UI text or logos for white-label purposes if you’re on the enterprise embed plan (which allows a “private label” option). This means you can remove the Looker logo and perhaps adjust fonts and colors to match your application better.
However, Looker dashboards' overall layout and interface cannot be changed to match your applications design system when embedded.
You are essentially showing a Looker dashboard inside a frame, so the visual language, chart functionality, positions of filters, the menu for downloading or exploring data, etc., all appear as they do in Looker. Looker does let you hide the top nav bar and some controls in embedded mode, giving a cleaner look.
And with URL parameters or the SDK, you can pre-filter data or switch themes. But you cannot, for example, redesign the dashboard’s structure or embed your own buttons inside the iframe’s content. The embedded content remains governed by Looker’s UI framework.
One notable aspect is Looker’s reliance on LookML (the modeling layer). If you want certain custom behavior (like a calculated metric or drill-down path), you often implement it in LookML rather than in the dashboard UI.
This is a form of customization, but it’s about data logic rather than visual appearance. It ensures consistent behavior, but doesn’t change how things look to the end user. For the end-user UI, Looker’s customization mostly means skinning the existing UI – there is “theming via LookML and URL parameters” and not much beyond that regarding layout control.
Because Looker does not allow embedding individual components, you can’t embed a Looker chart in a custom page with your surrounding elements (aside from placing it next to other iframes or content).
You must embed an entire Looker view (be it a single visualization or a whole dashboard) as one object. This all-or-nothing approach simplifies security and consistency, but means less flexibility compared to Sisense’s widget-level embedding.
The visualization options
When embedding analytics, the variety and flexibility of visualizations available is key. Can the tools create all the chart types you need, and how much can those visuals be tailored? Here’s how Sisense and Looker compare on data visualization capabilities.
Sisense
Sisense's dashboard builder includes a solid selection of standard chart types: bar/column charts, line and area charts, pie and donut charts, gauges, maps, scatter plots, pivot tables, etc.
For most common dashboard needs, Sisense has a built-in widget. The breadth of visuals, however, is not as extensive as some leading BI tools like Tableau or Power BI.
Users have noted certain limitations – for example, Sisense doesn’t natively support some advanced or niche visuals: one G2 reviewer mentioned “limitations on variability in the charts you create. You cannot create as complex visuals as in some other tools – for example, map charts and auto-bucketing for histograms.”
Essentially, the out-of-the-box chart library covers the basics well. Still, if you need highly specialized visualizations or very fine control (like dual-axis combo charts with custom spacing, or intricate geospatial charts), you might find Sisense lacking.
To mitigate this, Sisense has a Marketplace for add-ons and plugins. Through the marketplace, you can add community- or Sisense-developed widgets that extend functionality, such as more map types, advanced charts, and custom visualization templates.
Sisense BloX (mentioned earlier) even allows you to design custom visual components using code, which can be as flexible as your imagination (people have built things like interactive text-based widgets, custom tables with dynamic formatting, etc.) though you’ll have to configure them per-dashboard. So, while the core chart list might be moderate, Sisense offers paths to get more visuals if needed, albeit with additional effort.
Sisense dashboards allow some visual customization. You can change colors, set chart titles, configure axes and labels, and apply global themes. However, the UI might not support highly specific styling (like setting a custom shape for data points or conditional formatting beyond basic thresholds).
Compared to tools known for visualization flexibility, Sisense is sometimes described as a bit limited. One cause is that Sisense was an internal BI tool, re-worked for embedding and performance rather than maximum visual flourish—it provides “what you need” for KPI dashboards but not every bell and whistle in visualization.
The upside is that Sisense charts are straightforward and usually render quickly. The downside is that if your data analysts want a very unique chart style, Sisense might require a plugin or simply not support it directly.
For some embedded analytics scenarios, Sisense’s visualizations are sufficient (you typically see standard charts in most SaaS dashboards). But if your use case involves a lot of exploratory analytics or novel visual forms, it’s something to evaluate. The platform focuses on interactive dashboards and “no drowning in data – but also not an endless variety of visuals”, which is a common trade-off in embedded analytics tools.
Looker Embedded
Looker’s approach to visualization is centered on simplicity and consistency.
Looker supports roughly a dozen to 20 core visualization types, including bar, line, area charts, scatter plots, pie charts, single-value tiles, maps, and a few more. These cover most basic needs. However, Looker is not known for flashy or highly advanced visualizations. If you need something to empower data literacy for your end users, look elsewhere.
Many users agree that Looker’s offering is passable but can’t match the likes of Tableau or PowerB. It supports about 15 different types of charts with standard customization options.
That gives a sense of scale: it’s sufficient for common BI dashboards, but if you require a very specific chart type (say a network graph or a detailed trellis chart), Looker likely doesn’t have it natively.
One distinguishing feature is that Looker’s visuals are tightly linked to its data model. You don’t create a chart by manually dragging fields arbitrarily; you explore data through Looker’s interface, and the chart is a result of that exploration.
This means Looker ensures the data in the chart is always consistent with the definitions in LookML (good for trust in numbers), but it also means less free-form chart creation.
The customization on a Looker chart usually involves choosing the visualization type from the limited options available, assigning data fields to axes or series, and then tweaking some settings (color schemes, sorting, filters). It’s streamlined, but not great for creating highly bespoke visuals.
Looker does allow custom visualizations through its developer tools. One can build custom vis plugins using JavaScript (Looker has a Visualization API where you can code a new chart type and plug it in). This is analogous to Sisense’s plugin concept.
Some companies have leveraged this to create unique chart types within Looker. But it requires significant development effort and isn’t something an end user or analyst would do on the fly. Most Looker customers stick to the provided visualization types.
In terms of style, Looker charts have a modern, minimalistic look (some users appreciate the clean design). You can change colors and some formatting, but for example, you might not be able to control exact pixel spacing or use a custom font in chart labels – the look is consistent with Looker’s theme.
There’s no built-in concept of “storytelling” or adding rich text and media to dashboards (Tableau-style). Looker dashboards are interactive and nice for exploration (with filtering and drilling), but somewhat spartan in presentation flexibility.
For embedded analytics, the implication is: Looker will deliver crisp, standard visuals that integrate data from your warehouse in real-time – perfect for reliable KPI tracking – but if your application needs highly custom visual elements or a wide array of chart types, Looker might fall short without custom dev work.
Integrations and data sources
Embedded analytics doesn’t exist in a vacuum – you’ll need to connect to data sources and possibly integrate with other tools. Here we compare the data connectivity and integration capabilities of Sisense and Looker.
Sisense
Sisense, coming from the BI world, supports a wide range of data sources. It can connect to traditional SQL databases (e.g. MySQL, PostgreSQL, SQL Server, Oracle), modern cloud data warehouses (Snowflake, Amazon Redshift, Google BigQuery, Azure Synapse, etc.), NoSQL and big data sources (MongoDB, Elasticsearch, Hive), flat files like CSV/Excel, and even web services or cloud apps through APIs.
In fact, Sisense provides 100+ native connectors out of the box. A snippet from Sisense’s documentation shows the diversity, for example:
- Athena
- Redshift
- Synapse
- CSV
- Databricks
- Excel
- Google Sheets
- MongoDB
- MySQL
- Oracle
- PostgreSQL
- Snowflake, and more are available.
In practice, you can pull data from virtually any common source into Sisense for analysis.
Sisense offers two data modes: ElastiCube (cached) or Live Connect. The ElastiCube is Sisense’s in-memory columnar database. You can import and mash data from various sources into a Cube, and Sisense will query that for fast performance (good for blending data or handling heavy transformations).
On the other hand, Live Connect allows Sisense to query the source directly (e.g., run live SQL on your Snowflake or data lake) without storing it in ElastiCube. This flexibility is great for integration: if your app’s data is already in a warehouse, you might use live mode for real-time queries; if not, you can ETL data into Sisense’s cube.
Beyond data sources, Sisense has integration points like a REST API for automating tasks (managing users, scheduling, etc.) and embedding hooks to integrate with application authentication flows.
There are also specific integrations, such as embedding Sisense in other software like Salesforce or using it with identity providers for SSO. Sisense’s ecosystem includes things like plugins for AI (e.g., integrating Python/R scripts or connecting to Jupyter notebooks) and connectors to ETL tools (the Marketplace lists partners like Fivetran, Stitch, etc. for data pipelines.
For a developer embedding Sisense, the key integration aspects are usually: can it connect to our databases, and can it integrate with our app’s authentication/authorization? The answer for Sisense is generally yes – it supports SAML/OIDC for single sign-on and token-based embedding, and as noted, likely has a connector for whatever database you’re using.
However, one thing to be aware of is that Sisense’s connectors sometimes require configuration and occasionally have limitations (for instance, some community feedback says certain newer data sources might not be supported until Sisense updates its connector list, and documentation on connectors can be lacking.
In short, Sisense scores very well on data integration breadth. It’s designed to be a one-stop shop for pulling in data from multiple sources and combining them into dashboards.
Looker Embedded
Looker’s philosophy is a bit different: it traditionally works on top of your existing databases.
Looker does not store data itself (except cached query results); instead, it connects to your database or data warehouse and queries it on the fly. Thus, integration with data sources is mostly about database connections. Looker supports many SQL dialects – anything from MySQL, PostgreSQL, Oracle, SQL Server to cloud warehouses like Snowflake, BigQuery, Redshift, Azure SQL, and more.
It has native dialect support for many platforms (including Hive, Impala, IBM DB2, etc.), and you can define custom dialects for lesser-known databases as long as there’s a JDBC driver. If your data is in a SQL-accessible store, Looker can likely connect to it. Many estimate that Looker supports 50+ distinct SQL dialects/drivers.
Where Looker is a bit less flexible is connecting to non-SQL sources. Unlike Sisense, Looker doesn’t directly connect to something like an Excel file or a SaaS application’s API. The typical solution in Looker’s world is to load that data into a database (or Google Sheets -> BigQuery, etc.) and then let Looker query it.
This aligns with modern data practices (centralizing data in a warehouse). Looker slots in nicely for a company already using a cloud data warehouse. For one with data spread out in different apps without a unified warehouse, it might require building that pipeline.
However, since Looker is now under Google, it has some integration perks: deep integration with Google BigQuery and Google Cloud services. For example, BigQuery + Looker is a common pairing, leveraging BigQuery’s power for processing and Looker for front-end analytics. Looker also integrates with Google OAuth for authentication (if you use Google Workspace, your users can log into Looker easily), and it can integrate with Google Drive (for data exports, etc.).
Additionally, Looker’s API can be used to integrate with other systems – you can use the Looker REST API or SDKs (available in multiple languages) to fetch data or trigger actions from Looker programmatically. This means you could integrate Looker with other applications by pulling data via API, though that’s not the typical use case for embedding (embedding usually uses the Looker UI in an iframe, not data extraction).
Looker does offer some built-in “integrations” for sending data to other tools. For example, Looker alerts or schedules can push results to Slack, email, or webhook destinations. This might not be directly relevant to embedding, but it’s part of the ecosystem integration: if you want your embedded analytics to also notify users or integrate into workflows, Looker has some capability there.
In summary, Looker expects your data to be in databases it can talk to.
Pricing
Both Looker and Sisense use enterprise-style pricing: neither publicly discloses prices plainly, and both are on the high end of the cost spectrum.
Sisense
Sisense is known for having opaque and high pricing (you have to contact sales for a custom quote). In general, Sisense deals run in the five to six-figure range annually.
According to our research, the minimum price you’ll pay for Sisense is around $10,000 per year, and it can go well above $60,000 per year for larger or more complex deployments. Many Sisense OEM (embedding) deals even reach into $100k+ per year for enterprise-scale usage. In fact, one analysis of vendor data showed Sisense’s average deal at ~$50k/year with a wide range up to $167k.
Why such a range? Sisense pricing depends on multiple factors: number of users (creators and viewers), deployment mode (cloud vs self-hosted), and usage volume.
For internal BI use, Sisense often charges per named user (with different rates for “Designer” users vs. viewer users). For embedded scenarios, Sisense typically does not charge per end-user seat (since your customer user base could be large or unknown).
Instead, Sisense uses a capacity or consumption-based model. For example, Sisense’s embedded licenses may be metered by things like the number of server cores, RAM, or data volume (ElastiCube size) allowed rather than exact user counts.
Looker Embedded
Looker’s pricing is similarly enterprise and custom-quoted. Historically, Looker was often cited as one of the most expensive BI tools.
Note: we’re talking about Looker Embedded here, not Looker Studio (which is not suitable for production SaaS apps in most cases).
A rough rule of thumb is that Looker pricing starts around $60,000 per year for a basic deployment, and goes up from there depending on scale. For embedded analytics specifically, recent sources indicate Looker’s embedded analytics pricing begins at approximately $120,000 per year. This higher entry point for embed use-cases might reflect the fact that embedding typically involves a large number of end viewers.
Looker does not use a simple per-user pricing either. Instead, they consider factors like the number of Looker platform users (developers, explorers), end viewers (for embedded), and the overall query volume or scale. Looker’s official pricing defines three editions:
- Standard
- Enterprise
- Embedded.
The Embedded edition is tailored for OEM use and includes features like unlimited viewers (with usage limits) and the ability to white-label. All editions require you to talk to sales for a quote – there are no published prices.
However, anecdotal evidence from the community suggests a ballpark of $5,000 per month for a small deployment (which aligns with ~$60k/year). For embedding or larger enterprise deployments, six-figure annual deals are common.
An alternative to Sisense and Looker for embedded analytics
If Sisense and Looker seem complex, heavyweight, or costly for embedded analytics, you’re not alone.
Many product teams today are looking for analytics solutions built from the ground up for embedding into modern applications, allowing end users data exploration and decision making.
Embeddable was built specifically for user-facing embedded analytics, addressing many of the pain points seen in Looker and Sisense. You can think of it as a toolkit or set of building blocks for creating truly remarkable dashboard experiences for SaaS applications.
Embeddable takes an “embedded-first” (headless) approach, meaning it was designed specifically to be built into other software. Unlike Looker or Sisense, which impose their full BI UI, Embeddable lets you integrate analytics with complete control over the user interface and user experience.
Despite being developer-centric for flexibility, Embeddable also provides a no-code dashboard builder for convenience. This combination allows both quick setup and iterations, plus infinite extensibility. Critically, Embeddable emphasizes performance: it features a lightweight embedding layer, a performant data service, and built-in caching, enabling you to achieve very fast load times (often sub-second) for end-users.
Cost-wise and integration-wise, Embeddable is tailored for modern SaaS needs. It’s designed to be developer-friendly (with straightforward APIs and React components) and offers a transparent pricing model. Teams often find it more predictable and lower in cost than legacy BI solutions.
In essence, Embeddable provides the flexibility and control that Sisense and Looker struggle to give because of their BI-first design. It avoids the bloat, complexity, and performance issues that can arise when trying to shoehorn a full BI suite into a single embedded iframe.
Conclusion
Sisense and Looker are both powerful analytics platforms, but their origins as traditional business intelligence tools shape their embedded analytics capabilities. Both are solid options if you already use Sisense or Looker internally to analyze data.
However, if you need an embedded analytics tool without a steep learning curve, with great performance and flexibility, both are equally bad.
Instead, you might consider a dedicated tool for embedded analytics. With Embeddable, you get lightning-fast dashboards, deep customization, a huge variety of visualizations and predictable costs.
Frequently asked questions
What is the main difference between Looker and Sisense for embedded analytics?
The key difference lies in their customization and developer experience. Sisense allows deeper customization through APIs, SDKs, and headless embedding options like Compose SDK, while Looker is limited to iframe-based embedding with light theming. Sisense offers more flexibility if your team has technical resources, whereas Looker is more rigid but easier to implement at a basic level.
Can I embed individual charts or components using Looker or Sisense?
Looker does not allow embedding individual chart components natively; it only supports embedding entire dashboards or visualizations via iframe. Sisense, on the other hand, allows embedding individual widgets using Sisense JS or Compose SDK, making it a better fit if you need more granular embedding and layout control.
How do Sisense and Looker handle user authentication in embedded scenarios?
Both tools support token-based authentication and SSO. Sisense allows for more flexibility through custom authentication flows and API-level access control. Looker uses signed URLs within iframes and supports Google OAuth and SSO, but it requires mapping users inside Looker, which can be limiting in multi-tenant environments.
Why might someone choose Embeddable over Looker or Sisense?
Embeddable is purpose-built for embedded analytics. It provides full UI control, fast load times, and unlimited customization using React or Vue components. Unlike Looker and Sisense, it avoids iframe limitations and offers transparent pricing, making it more suitable for modern SaaS applications that need flexible and performant embedded analytics.