Community Creations: Examples of awesome analytics experiences built with Embeddable
We explore some of the examples of awesome analytics experiences which have been built with Embeddable, and explore what makes them so unique and impactful.
Summarize with:
If you're planning to build remarkable charts and dashboards into your application for your customers, you'll likely be looking for a native-feeling experience that matches your design system and delivers value effortless to your customers. In most tools, this is not possible, because you have limited control over the charting components (and you'll probably have to embed it using a slow, clunky iframe too).
With Embeddable, we take a completely unique approach - giving you full control over the frontend code whilst handling all of the backend complexity for you. Embeddable is also embedded using a web component so that your analytics have a fully-bespoke, highly performant and fully-native feel.
Many of our customers are taking advantage of this flexibility and control to deliver unique, impactful and delightful dashboard experiences for their customers. Here are a few examples...
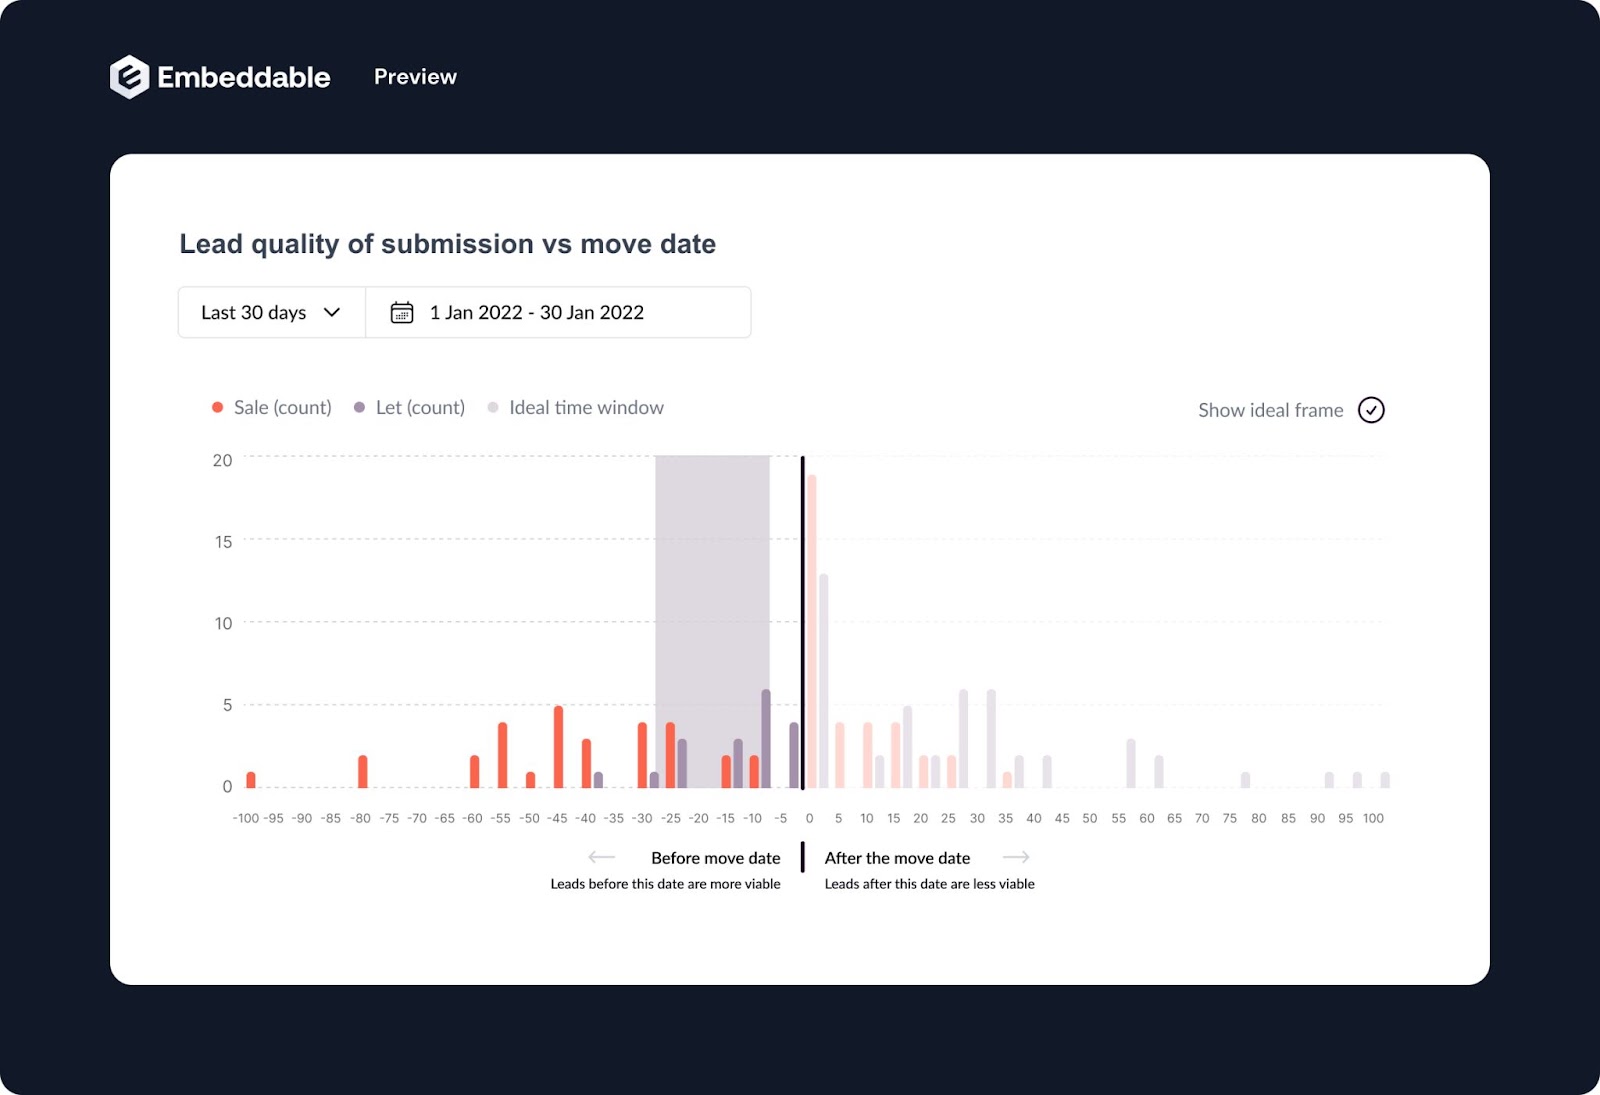
📈 Bespoke bar chart with dynamic contextual signposting & date controls
Just Move In wanted a design that could clearly and simply tell the story of the data to their customers in a contextual experience that provides storytelling around the data presented.
This Embeddable is built with:
⚡️ Graded bar chart with conditional styling and contextual signposting
⚡️ User-friendly data controls and 'take me to safety' data-range reset
⚡️ Custom colors, fonts and spacing
This charting component delivers considerate contextual cues around the data that help the viewer understand the context of the chart, and provides them a neat little flourish that helps them see the ideal view of the data, but also allows them the flexibility to modify that view - resulting in a perfect balance of direction and freedom for their customers ⚖️
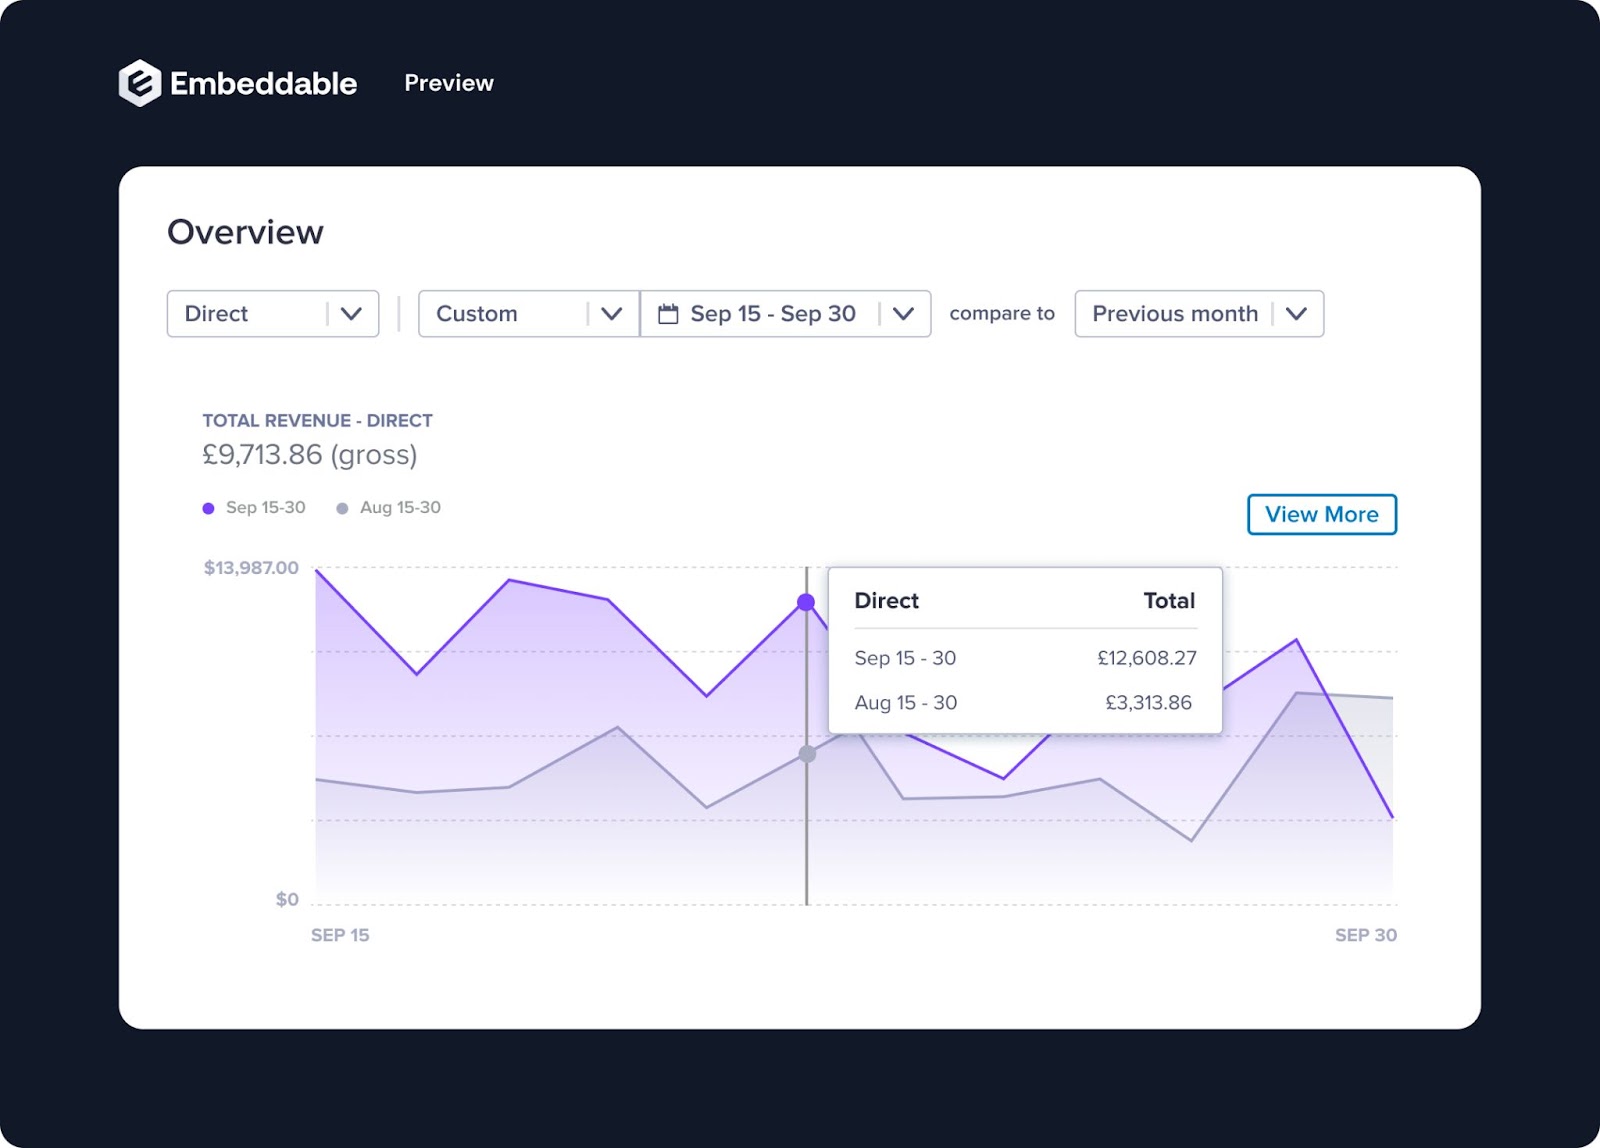
📈 Configurable Area Chart with Bespoke KPI Highlight, Drill-down and Modal
Direct wanted a custom analytics experience which housed a dynamic area chart with controls for the end user, but which persisted the contextual KPI information and enabled the user to easily find more information if needed.
This Embeddable is built with:
⚡️ Dynamically-responsive area chart with comparison modal on-hover
⚡️ Persisting KPI Header, filters, date picker & comparison options
⚡️ Custom colors, fonts and spacing
This one's a simple, recognisable core design but with some key flourishes that make it fully-personalised to Direct's use case. Because they are able to control the entire UI & UX of their analytics experience with Embeddable, they are able to achieve an elegant balance of form and function that delivers an intuitive experience for their users 💪
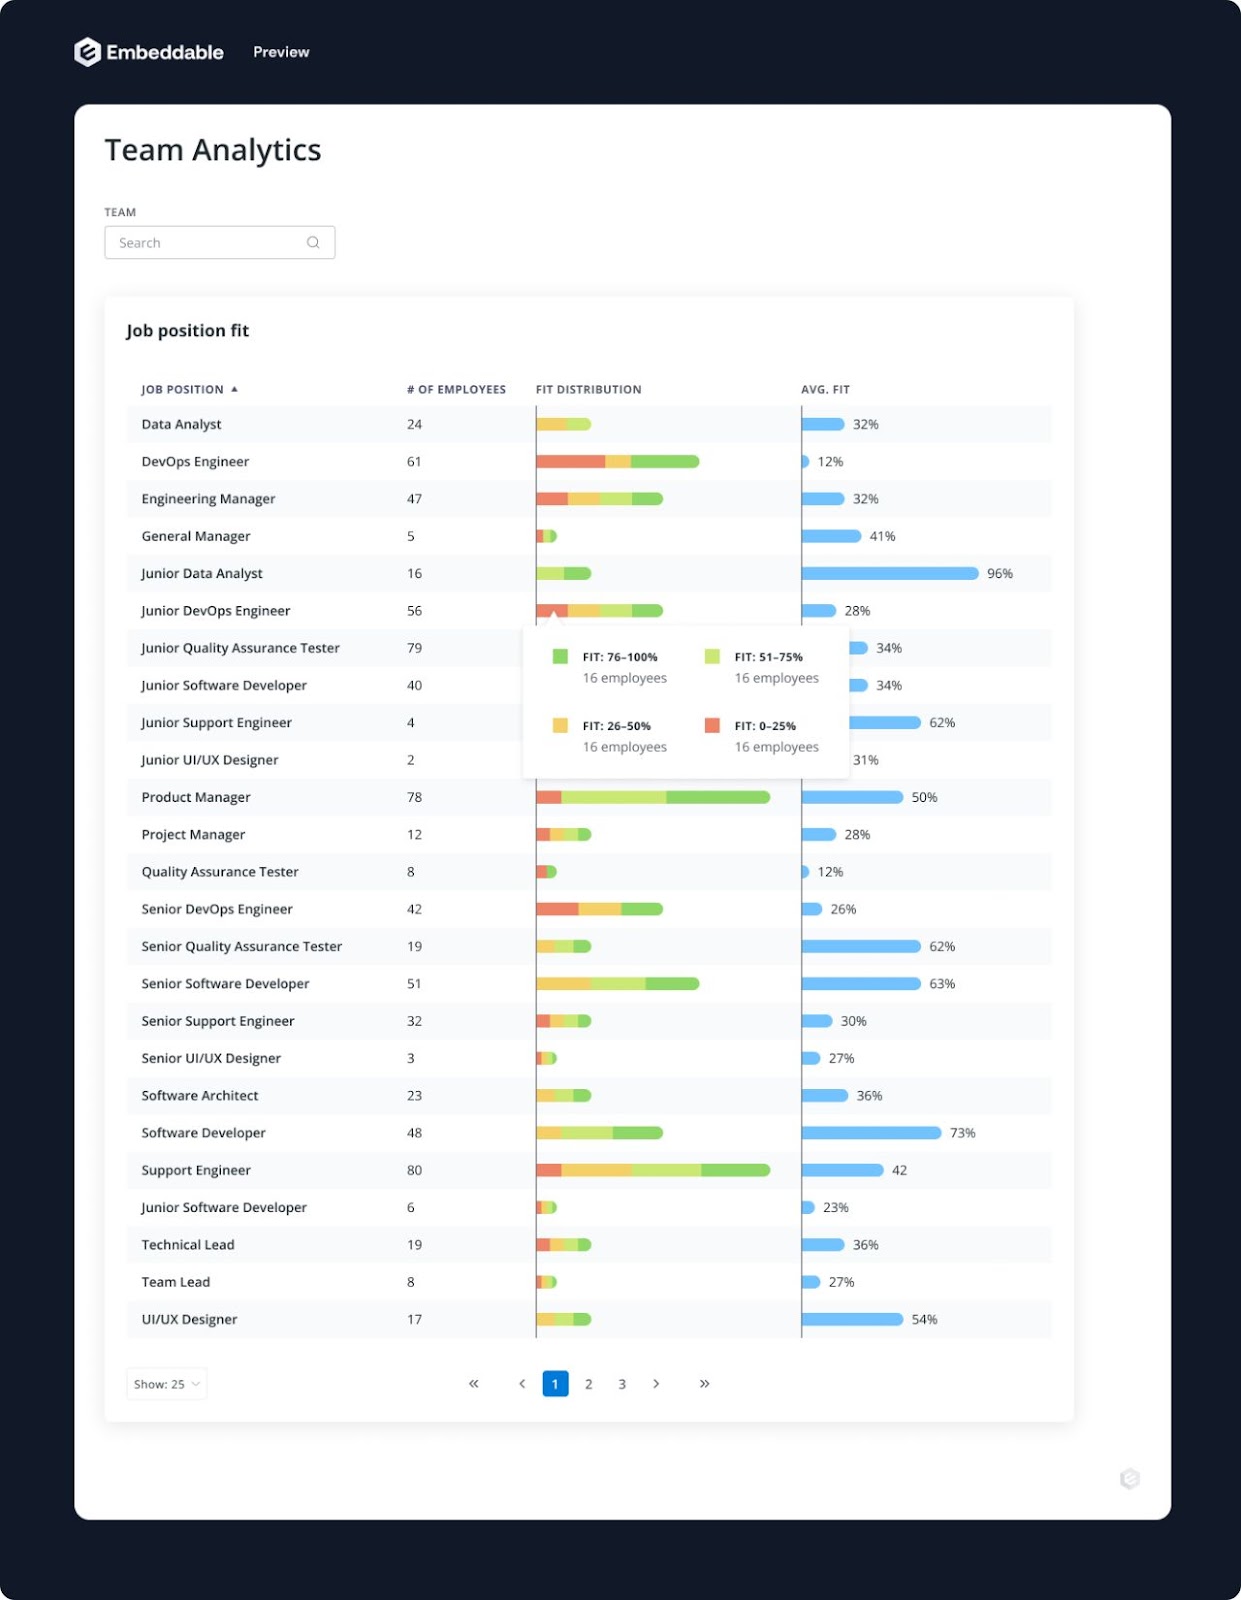
📊 Searchable Table-Chart with Nested Stacked Bars, Sorting & Hovers
DevSkiller wanted to present a single view that housed and clearly communicated a LOT of hierarchical data. It may look like a simple analytics experience at first glance. It's actually a very complex design, which is elegantly conceptualized to become simple, clear and insightful in the eyes of the viewer.
This Embeddable is built with:
⚡️ Nested horizontal stacked bar charts with dynamic insight modals
⚡️ Search-based filtering, click-based sorting & progressive disclosure
⚡️ Custom colors, fonts and spacing (of course)
A masterful 'matroyshka doll' of analytics experiences 🪆 - this Embeddable contains a main charting component housing dynamic sub-charts, which use progressive disclosure to display their own modalized sub-charts... and yet it still feels light and perfectly intuitive. DevSkiller are using their dev skills to perfectly visualize their users dev skills here 💪
P.S. It goes without saying that this is not achievable with a regular embedded analytics tool...
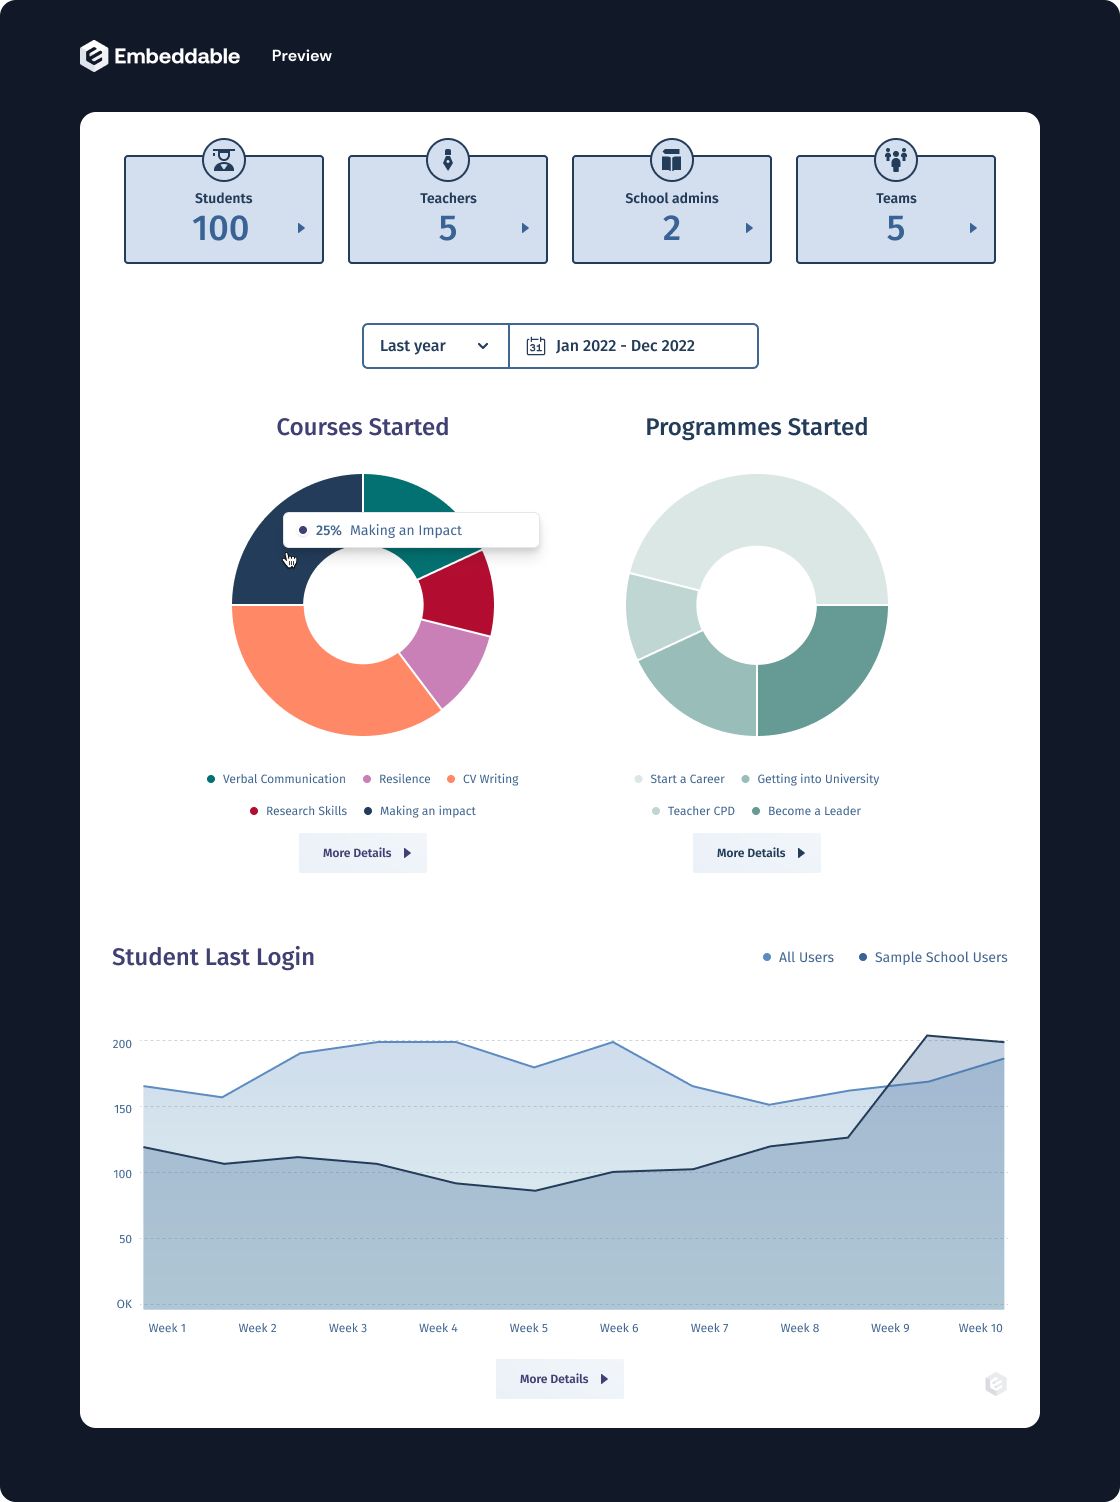
📊 Interactive Multi-Chart Analytics with Custom Iconography & Drill-downs
For their first Embeddable analytics experience, EtonX wanted to enable their users to see a quick overview of engagement on their courses and programmes, with the ability to easily delve into the underlying data. A clean, well-structured and interactive solution was needed.
This Embeddable is built with:
⚡️ Fully-bespoke charting elements, designed specifically for purpose
⚡️ Intuitive interactivity including date selections, drill-downs and hovers
⚡️ Custom iconography, colours, fonts and spacing
Overall, we think it's a friendly design that delivers with simplicity and intuitive interactions. And what's more, we spoke to Catherine from the team and she went to far as to say that "Embeddable is the best customer experience I've ever had, you guys blow everyone else out of the water." (Kind words, thank you. We do our best 🙏)
📊 An Integrated Plot Chart, Stacked Bar Chart and Insight Modules
Softools wanted to achieve a simple, bespoke design based on the RAG status of their projects. The key was to ensure that viewers could immediately get the insights they needed from a simple glance, but also be able to easily interact to drill deeper if needed.
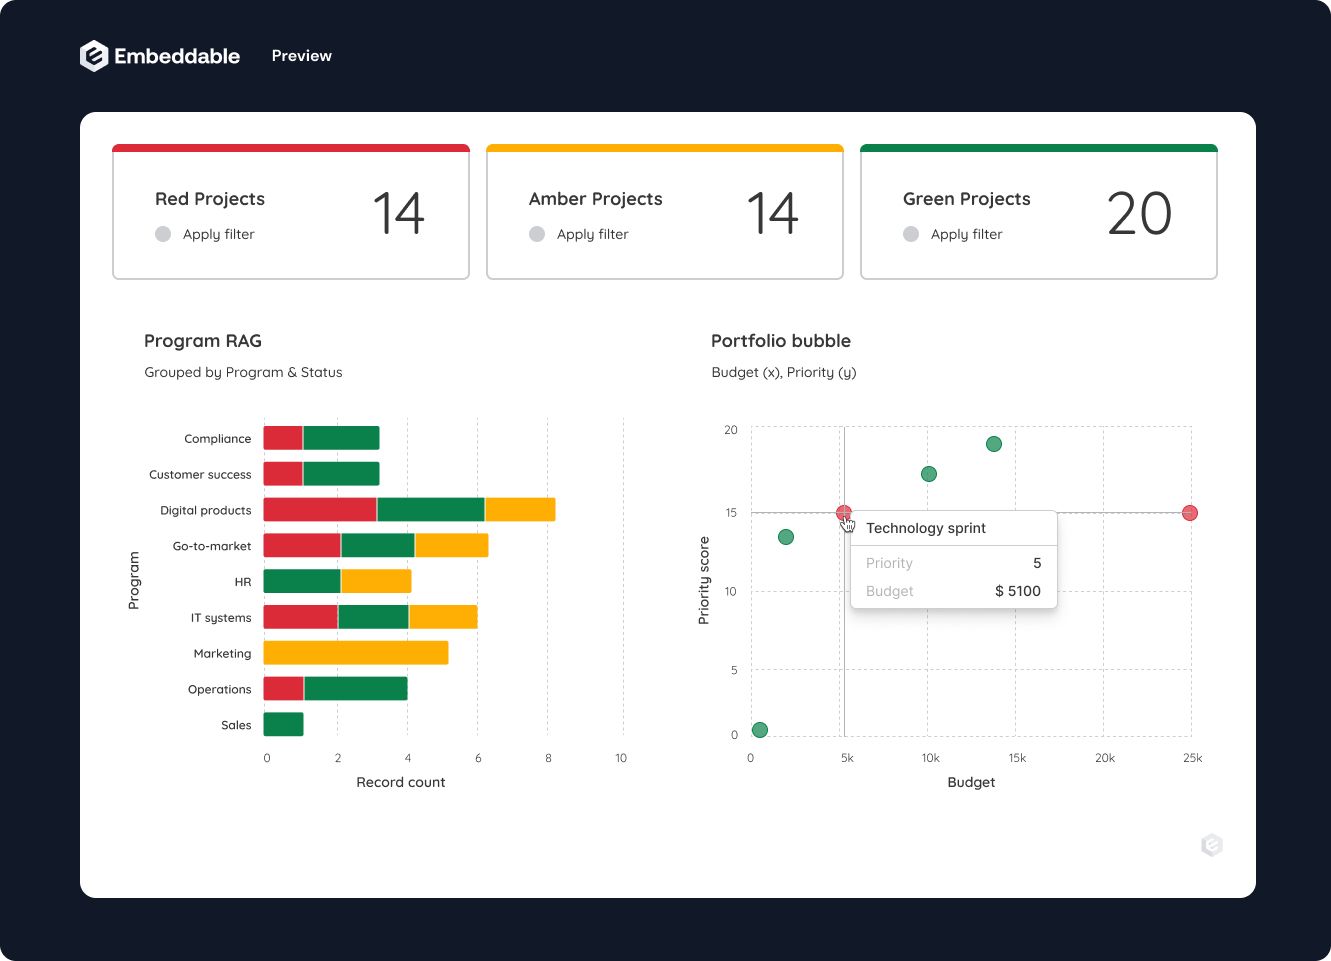
Embeddable Analytics Design for
This Embeddable is built with:
⚡️ Intuitive integrated filtering (click on any element to filter)
⚡️ Custom hover-interaction with insights modal housing drill-down data
⚡️ Custom colours, fonts and spacing
Although a seemingly simple design for a simple purpose, this level of customisation would not be achievable in any of the leading embedded BI tools.
With Embeddable, Softools are able to deliver a user experience that's beautifully simple, elegant and truly fit for purpose ✅
📈 An Elegant Line Chart with Interval Filter, Comparison and Dynamic Insights
Scalapay required a super-sleek and simple visual language for their analytics - simplicity, practicality and elegance is the name of the game!
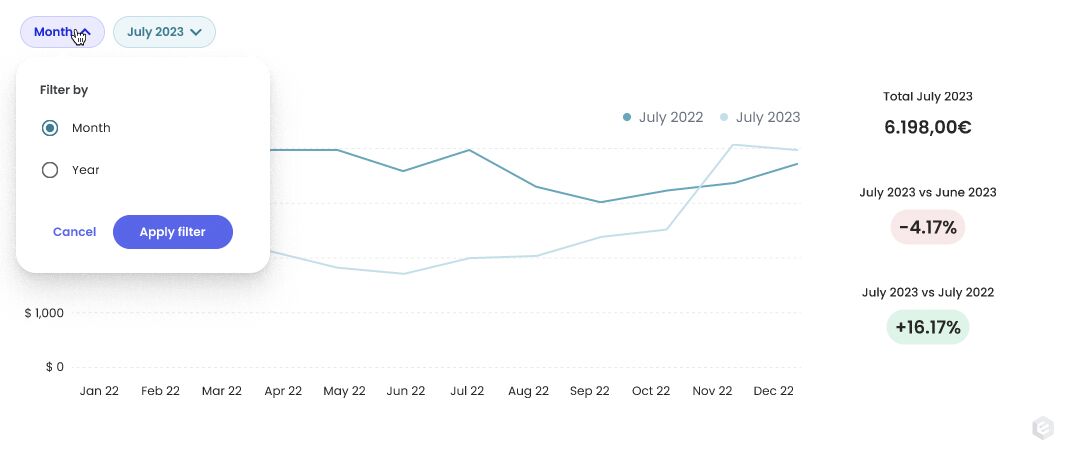
This Embeddable is built with:
⚡️ Bespoke, intuitive drop-down and data selection with radio buttons
⚡️ Modified KPI widgets with dynamic colorways and sleek, native design
⚡️ Custom buttons, colours, fonts and elements from the applications design system
This was the first charting element built with Embeddable for Scalapay, and forms part of a broader, on-brand analytics experience. Scalapay's simple and intuitive analytics are achieved by blending native design elements with simple, functional UX to create a holistically user-friendly experience that delivers value, simply and effectively.
Summary
The best examples of customer-facing analytics offer a fast-loading, native-feeling experience to users. They should be simple and functional, allowing the user to find the insight they need easily and intuitively. To achieve this, companies need to carefully consider things like progressive disclosure, the incorporation of familiar branded elements from their design system, and be careful not o add unnecessary complexity.
To achieve this, our partners are using Embeddable, to allow them full control over the front-end UX and UI, whilst embedding using a web component that ensures a fully-native feeling. Our unique approach allows you control over bits you want to control, whilst handling all the backend complexity you really don't want to spend engineering time on, meaning you can deliver remarkable charts and dashboards to your customers, ten times faster.
If you're looking for more inspiration on what you could build with Embeddable, take a look at these 6 examples of remarkable customer-facing analytics experiences. 6 not enough? we've also reviewed a further five examples of analytics experiences we love here.
Want to explore using Embeddable to create remarkable analytics experiences for your customers - get in touch with the team and we'll be glad to explore your project with you.