8 Great Examples of User-Facing Analytics
In this article, we talk about our favorite examples of user-facing analytics. You’ll find out what we like about each one and see screenshots of them in action. We’ll also discuss a few popular use cases for embedding analytics into your app. We hope this gives you inspiration for your own plans.
Summarize with:
Whatever problem your product solves, part of your mission is to make sure your customers understand its value, stay engaged, and recommend it to others.
That’s why user-facing analytics is on your roadmap: It’s an opportunity to upgrade your customer experience, placing useful data right in the app where they need it most.
But what makes for remarkable customer-facing analytics? The first thing is flexibility and data freshness. Can users find exactly what they’re looking for to support their decision-making? Can they adjust the aggregations and see accurate data visualized in different ways?
That’s not all. The best embedded analytics solutions out there are totally cohesive with the brand and visual guidelines of the rest of the app—an extension of the existing fantastic user experience rather than a gap in it.
In this article, you’ll find use cases of user-facing analytics to give you an idea of what’s working for other businesses right now. Then, we’ll dig into real-life examples of impressive analytics solutions to give you inspiration.
If you enjoy these examples, you can also check out our "Part 2" where we cover 5 more examples of excellent analytics experiences.
Do you want to build remarkable analytics experiences in your own app? Learn how.
What is user-facing analytics?
User-facing analytics is data your customers can access and explore directly inside your product. Instead of being locked away in internal dashboards, it’s built into the app experience where users spend their time.
You may also hear it called customer-facing, client-facing, external-facing, or in-app analytics. Though these all refer to the same thing, user-facing analytics is not the same as user analytics. User analytics is an internal discipline for tracking how people use your product. User-facing analytics, on the other hand, is data you put in your customers' hands so they can make better decisions with it.
User-facing analytics examples to help you get inspired
It can be complex to build customer-facing analytics into your app. Pulling it off means prioritizing a slick user experience that fits seamlessly with the rest of your product—all while giving users flexible aggregations and useful data visualizations that help them do their jobs.
Next up are some examples of user-facing data analytics from companies we think have nailed it.
1. Stripe
Stripe is a household name when it comes to payment processing. If you haven’t paid for something via Stripe yet, well—believe us: You have.
But, why is Stripe so successful? It understands what its users are looking for and delivers it in a remarkable way.
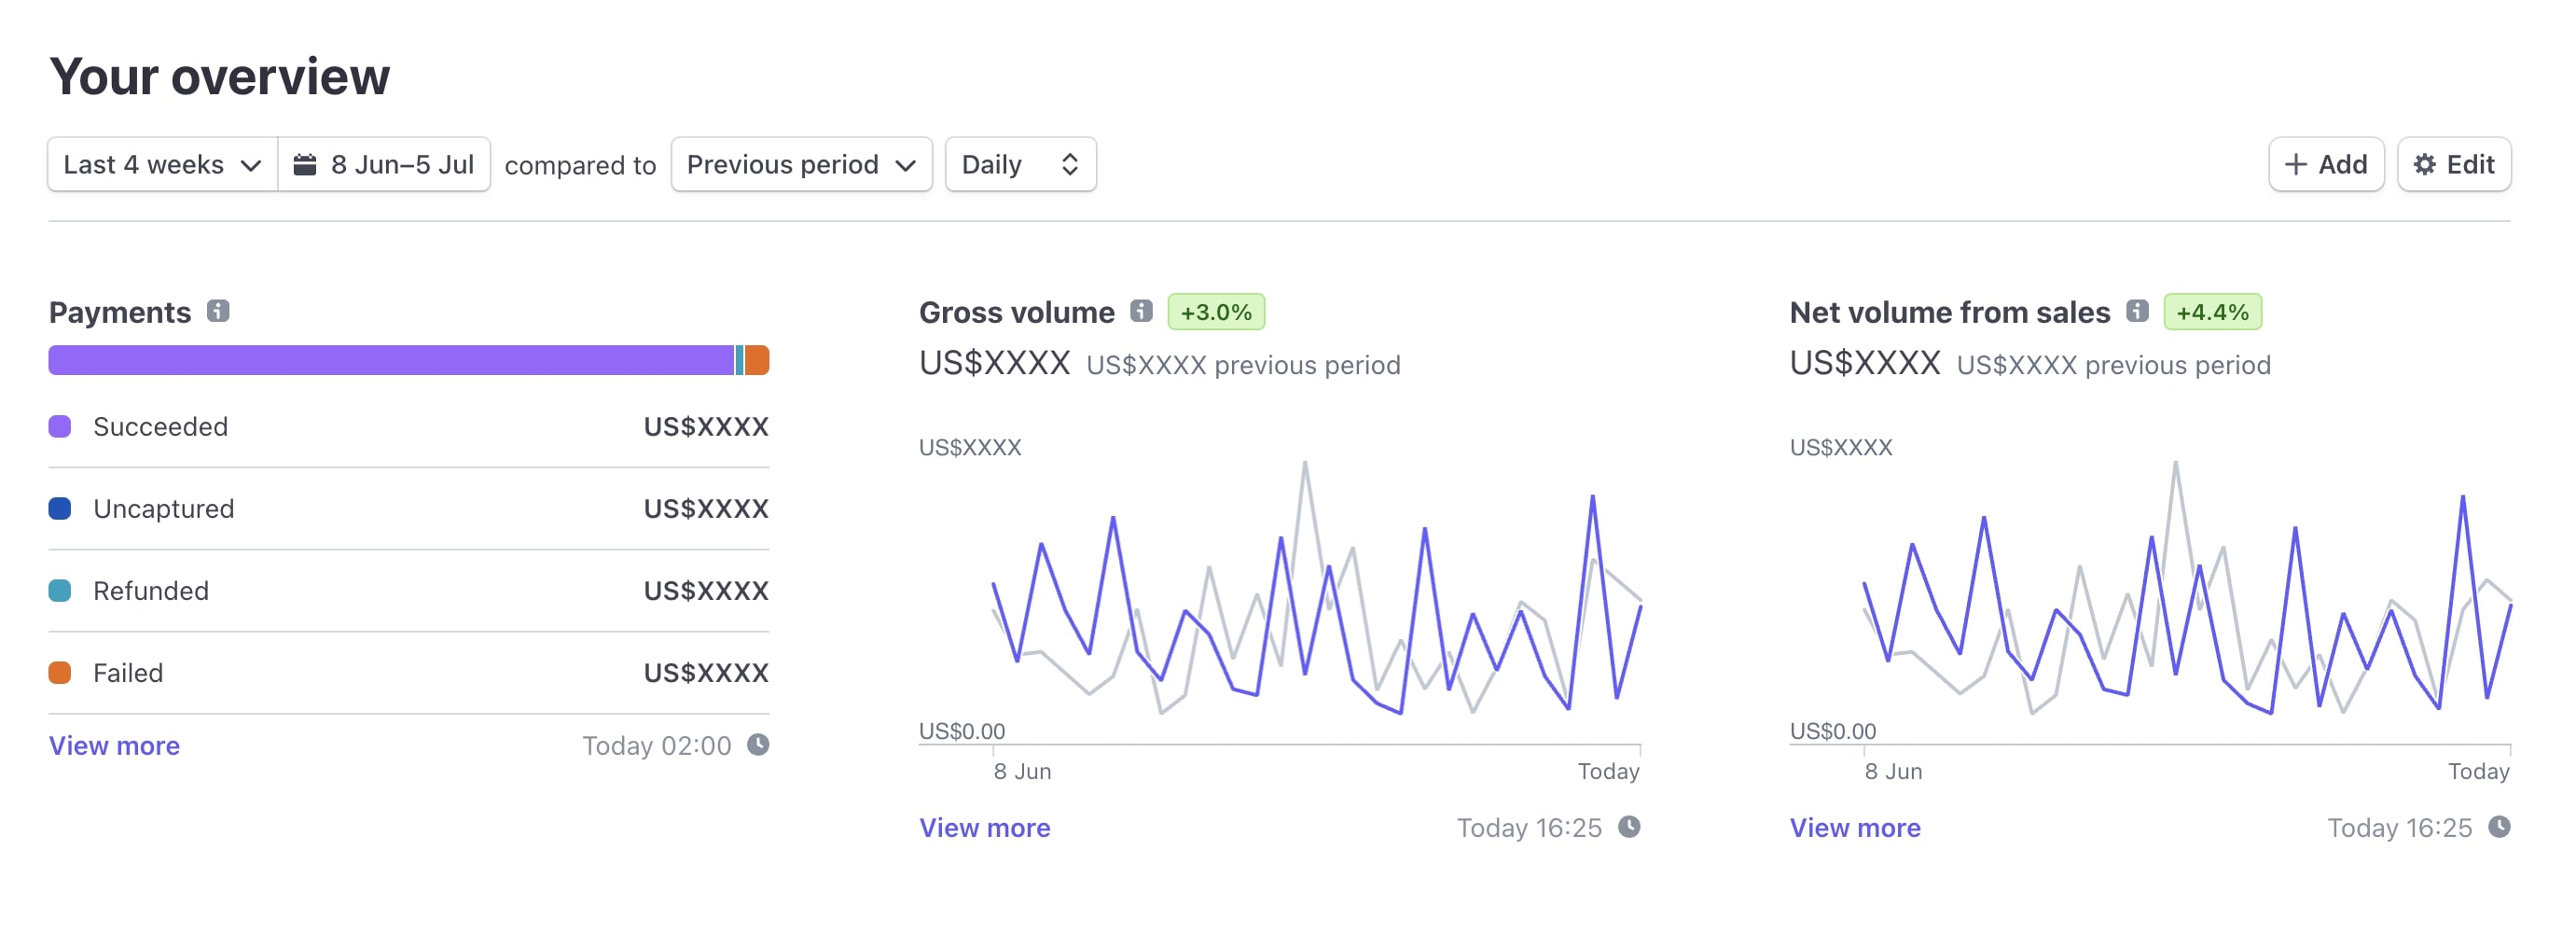
As a payments processor, analytics aren’t necessarily the core piece of Stripe’s offering, but the dashboard is right there on the homepage when a user logs in, which goes to show how valuable these insights are. Users can find out metrics like gross and net payments received over a particular period and see how they compare to previous periods—all crucial to understanding a business’s financial health.
Each element of the dashboard is intuitive, easy to navigate, and has a load of useful, custom subcomponents and logic within each component. So there’s a lot of flexibility in terms of what data users can access. But it’s the attention to detail we love the most. For example, every transition follows the protocols of the rest of the platform, meaning the brand experience is totally consistent throughout.
2. Squarespace
Squarespace changed the game with its AI website builder and hosting platform. That said, analytics was something of an afterthought in the company’s early days. Most users turned to Google Analytics and other solutions to get an idea of how their website was actually performing. So to increase the perceived value of its service, Squarespace dramatically improved the quality of its data analytics.
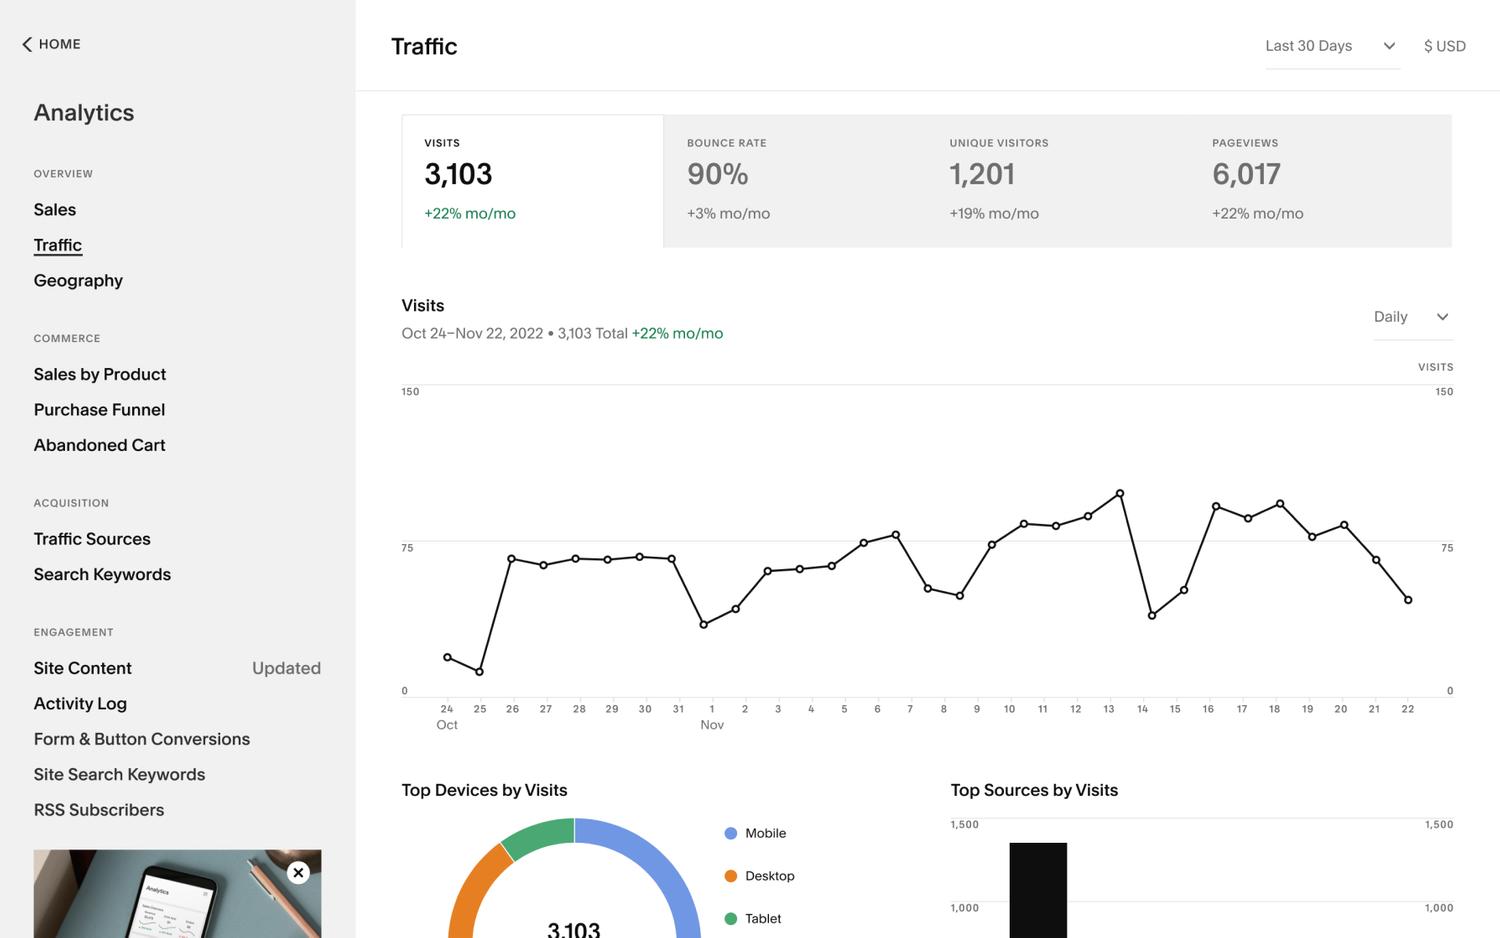
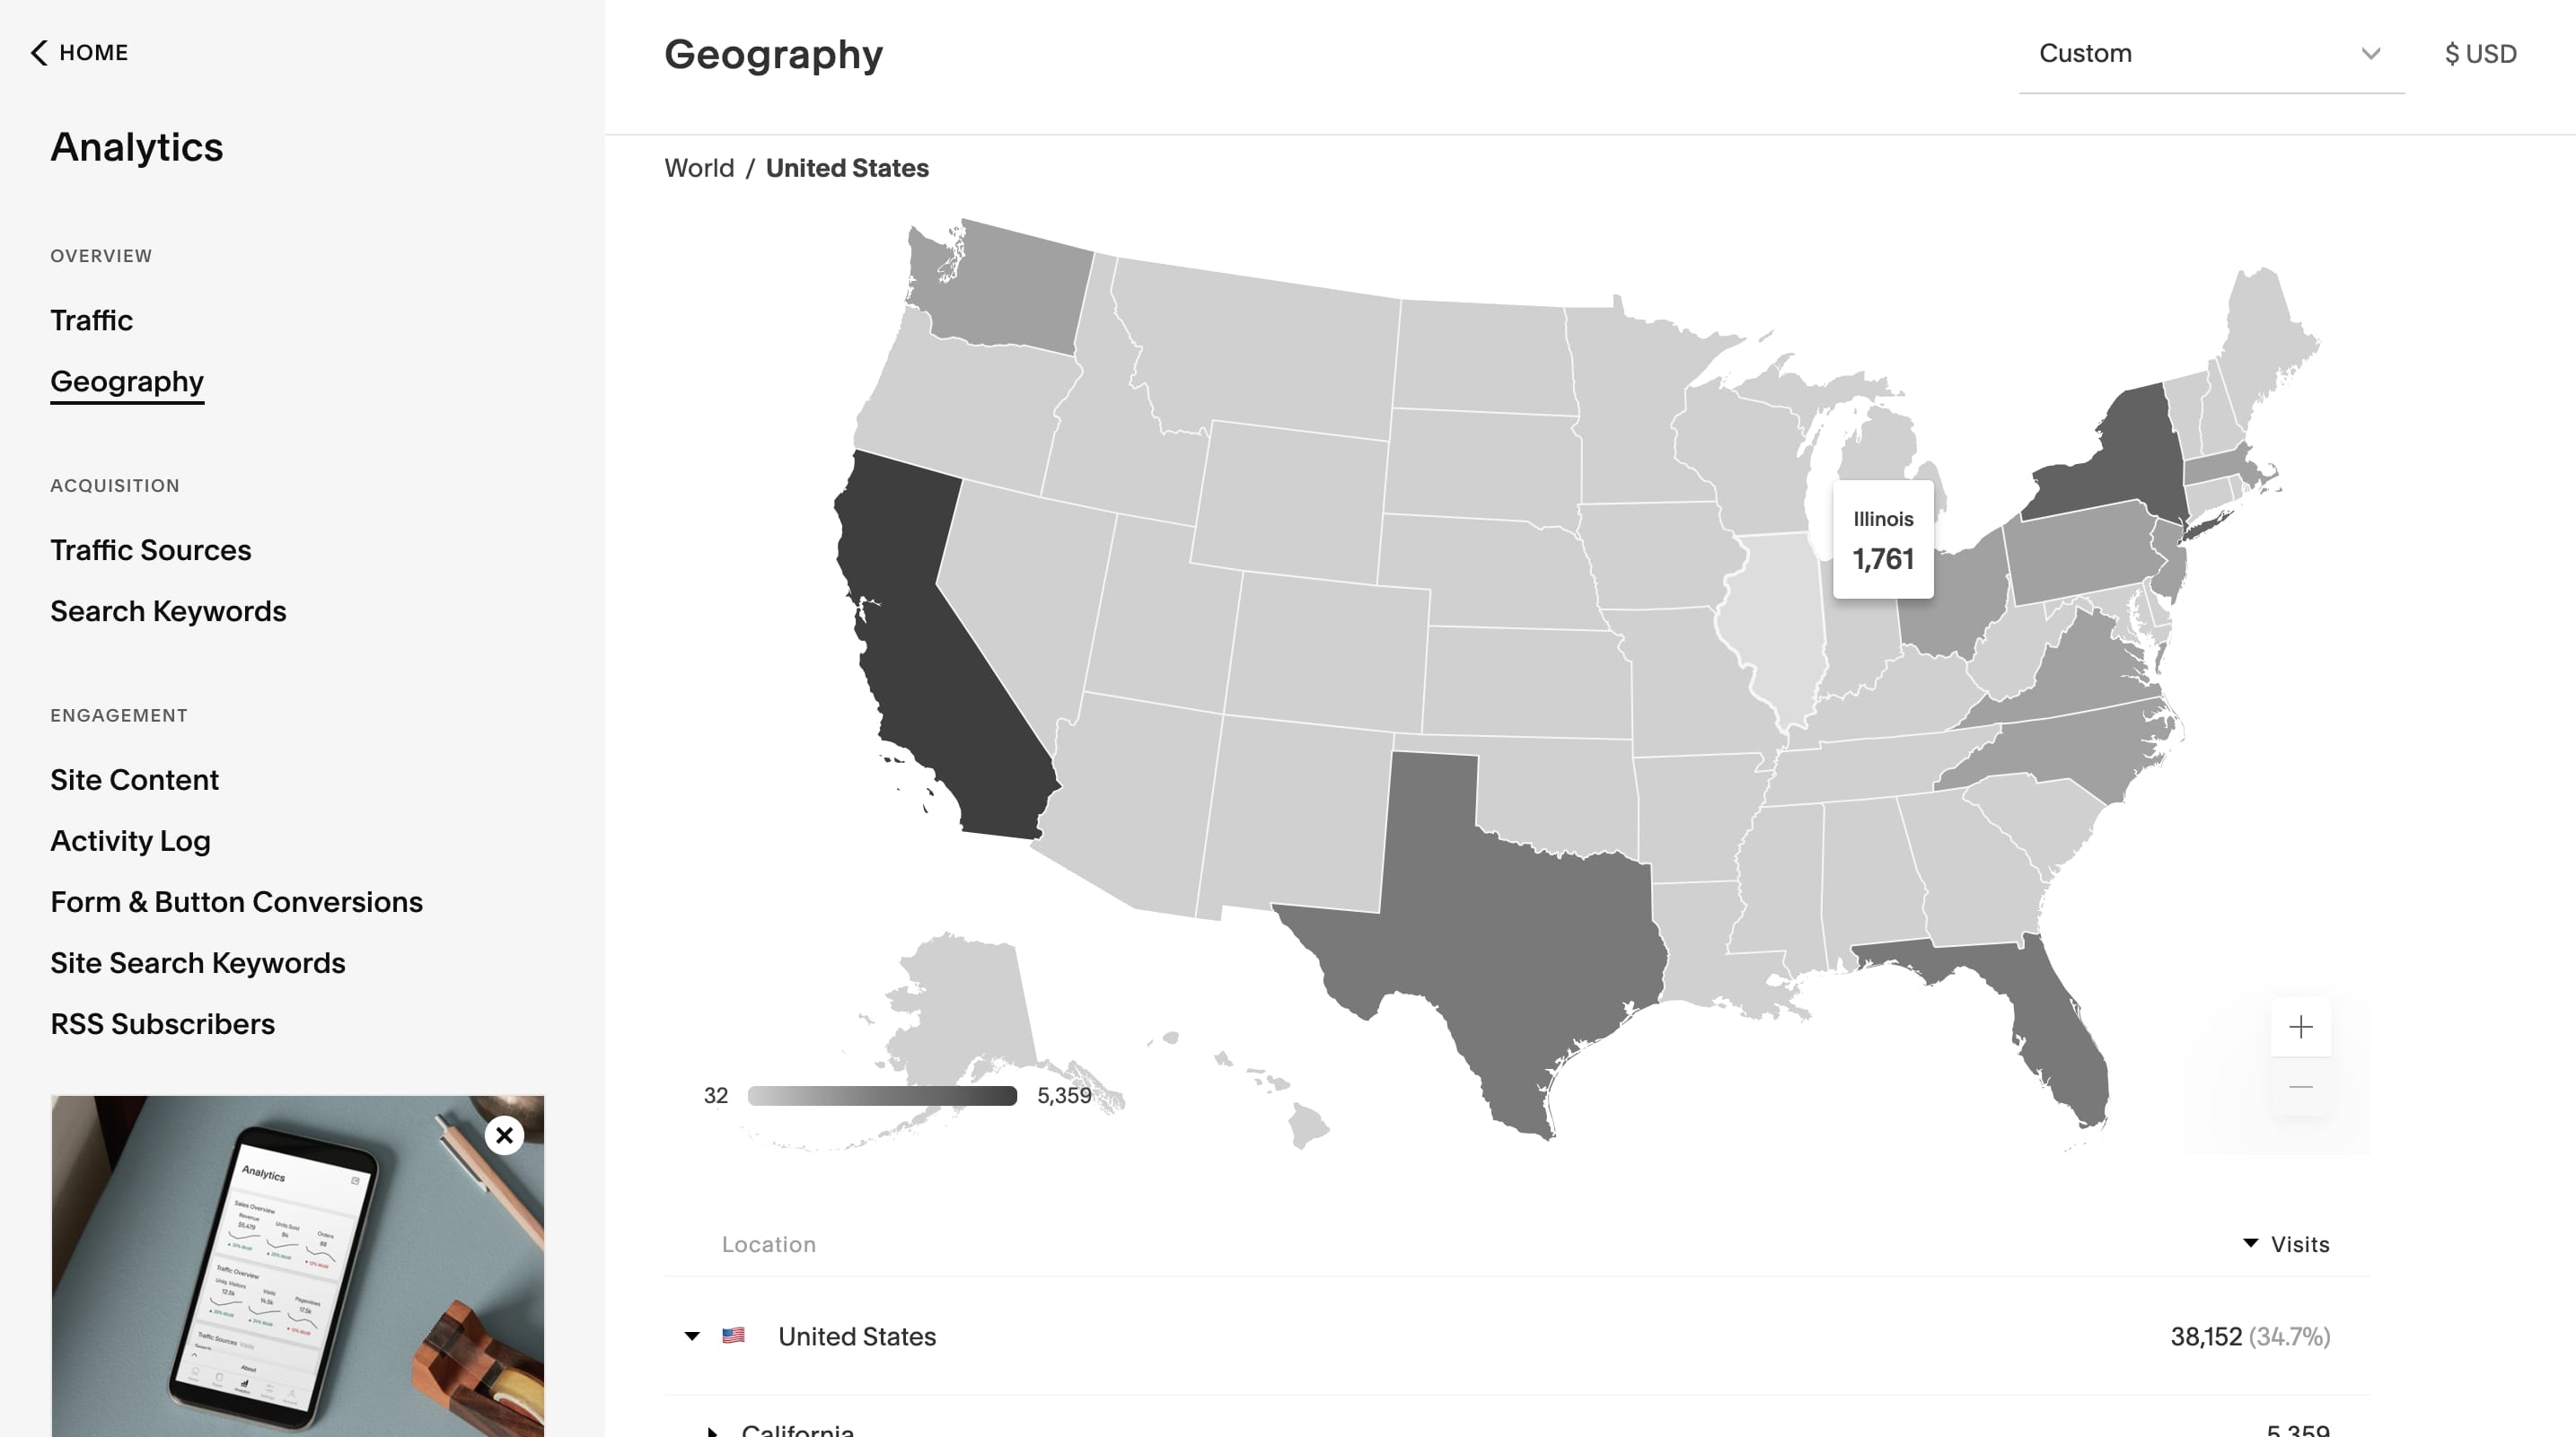
The site gives you multiple views depending on what the user is looking for (e.g. Geography, Traffic Sources, and Site Content). They can view preset or custom date ranges, which will persist even when they toggle to a different view.
Its analytics interface loads quickly, which gives users access to a range of metrics such as time on page, bounce rate, and exit rate as soon as they open the panel. Users can also see which devices, search engines, and even search terms have brought visitors to the site—and what page they then visited based on their search.
Rather than compete with Google Analytics, Squarespace has introduced a pretty seamless integration that allows users to combine data from the two sources right within Squarespace itself.
Additionally, Squarespace analytics work really well on mobile devices too, showing the level of consideration the product team has undertaken to make sure this solution serves its users everywhere.
3. Spotify
If anyone knows how to leverage data, it’s Spotify. From the listener’s perspective that means new music recommendations powered by clever algorithms and experimental features like ever-changing playlists. But artists, podcasters, and publishers that use Spotify also get access to all kinds of useful data that drives business decisions.
The analytics found on Spotify can be used to help artists plan venue sizes, locations, and dates of tours, as well as tailor their marketing campaigns according to their listener demographics.
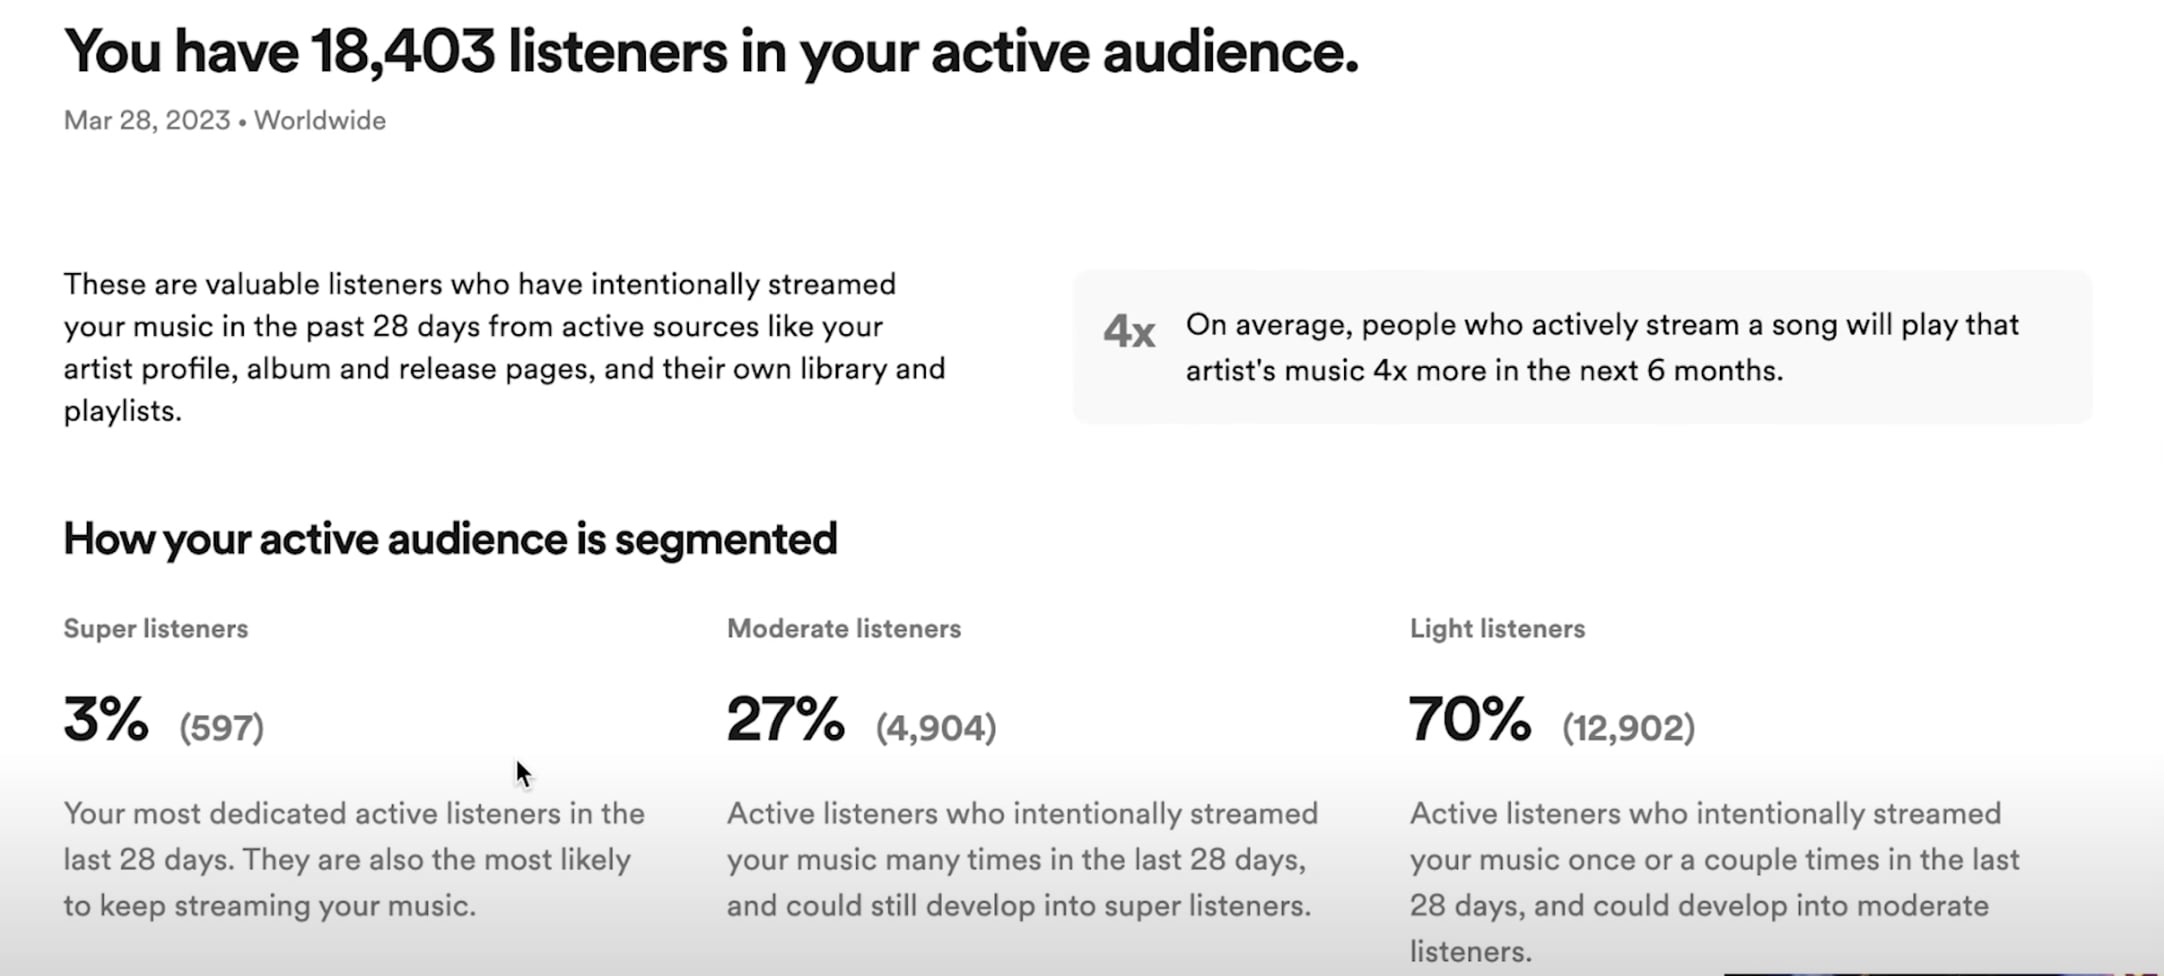
The platform takes a unique design approach on its analytics pages, emphasizing text-based stats at the top of each tab rather than showcasing a load of charts and graphs. You can toggle between time periods to see listeners, streams, and followers, but it all looks really non-threatening for users without a tech background.
For those with more advanced goals, there are still options to explore the data in more depth, using bar charts and graphs lower down on the page. Of course, it’s Spotify, so their visual branding is absolutely on point too.
4. Mailchimp
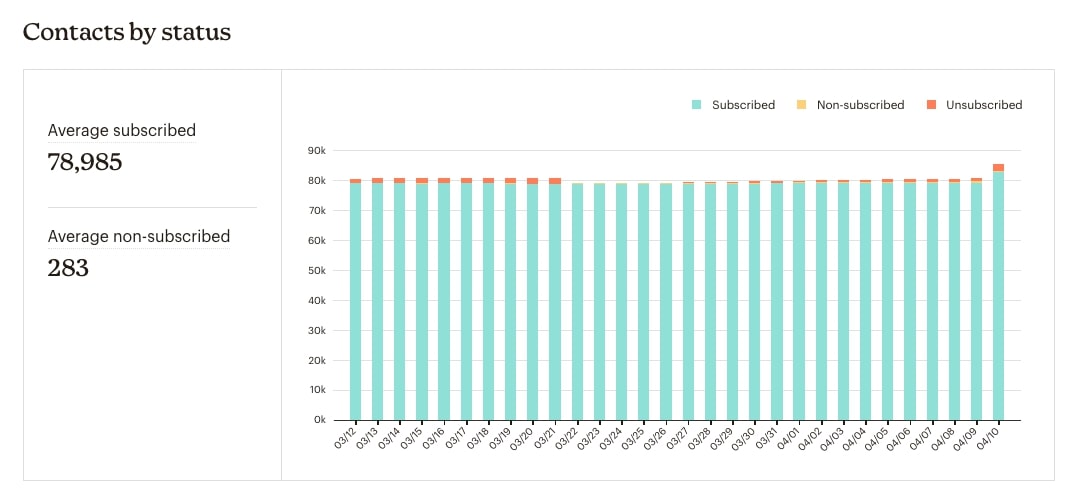
Mailchimp is an email and marketing platform that gives businesses the option to design, automate, and analyze marketing campaigns. Users get comprehensive audience analytics to track the growth of their contact lists over time. The ‘Contacts by status’ section shows the number of subscribed, unsubscribed, and non-subscribed contacts with a date picker for analyzing specific time periods.
One thing Mailchimp excels at is embedding analytics right on a campaign level. Users can analyze real-time results of A/B tests as well as more general stats like open, bounce, and click rates (they can even check these metrics in relation to industry benchmarks—a nice touch).
The one area where Mailchimp has room to grow is cross-campaign navigation. Digging deep into a single campaign is straightforward, but pulling together a view across multiple campaigns still requires more clicking around than feels necessary.
5. Fin (Intercom)
Fin, formerly Intercom, is an AI-driven customer service platform that helps teams manage messaging-based support at scale. It also comes with an analytics platform that makes it easier for managers to track customer support metrics while setting team KPIs.
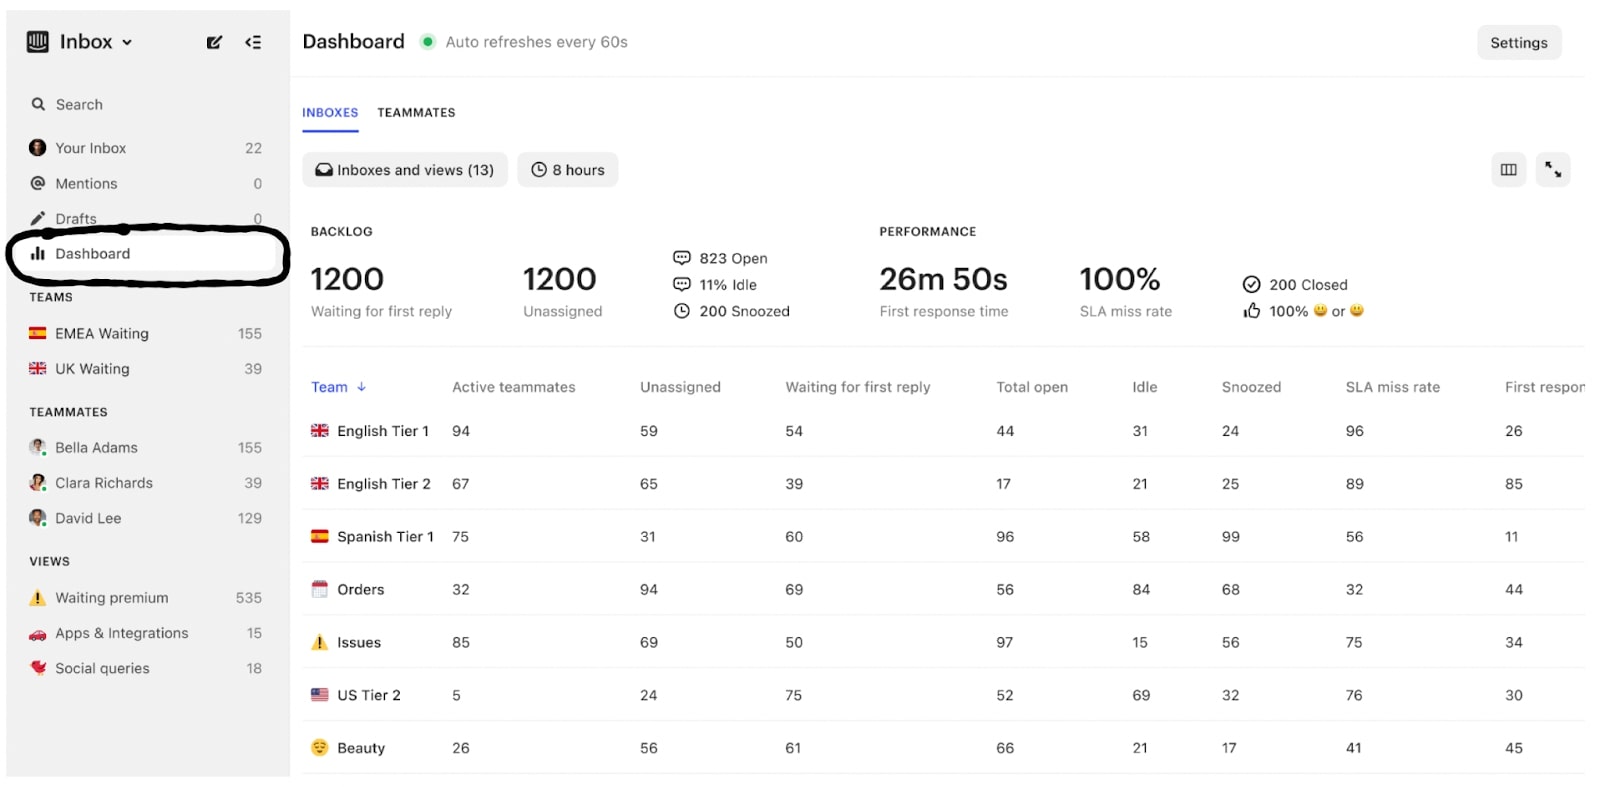
Fin’s real-time analytics dashboard (available on higher-tier plans) gives an overview of the organization’s inboxes and customer support teams, showing at-a-glance metrics like total number of messages waiting for a reply.
What’s good about it? One key feature is that managers can add their own charts, choosing from charting components like counts, line graphs, or table charts. Teammates can group or filter customer charts according to different attributes, and there’s no limit to the number of charts you can add.
Fin’s charts are very user-friendly, using date pickers to help team members dig deep into the data. It also uses custom subcomponents to show relevant info like the team’s progress since the previous period. Metrics like SLA and customer satisfaction score (CSAT) update every 15 mins, but the rest are set to auto-refresh every 60 seconds while the dashboard is active, so it’s good and fresh too.
There’s also a dedicated tab for monitoring team inboxes. Not only can you see metrics like active teammates, conversations waiting for a first reply, and so on, but you can check the team’s availability, capacity, and performance. Managers can hover over a team’s name in the inbox to see which teammates are assigned to that team, who’s active, and the number of open conversations and tickets. Best of all, everything is easy to navigate and fits Fin’s branding perfectly.
6. Shopify
Another big name in its industry, Shopify is an ecommerce platform for starting or growing an online business. Its analytics dashboard gives users the opportunity to review the store’s activity, get visitor insights, and analyze transactions. But really that’s just the tip of the iceberg of Shopify’s analytics.
Our favorite feature is the Live View, because it visualizes data in a completely unique and engaging way while sticking to the overall look and feel of Shopify branding.
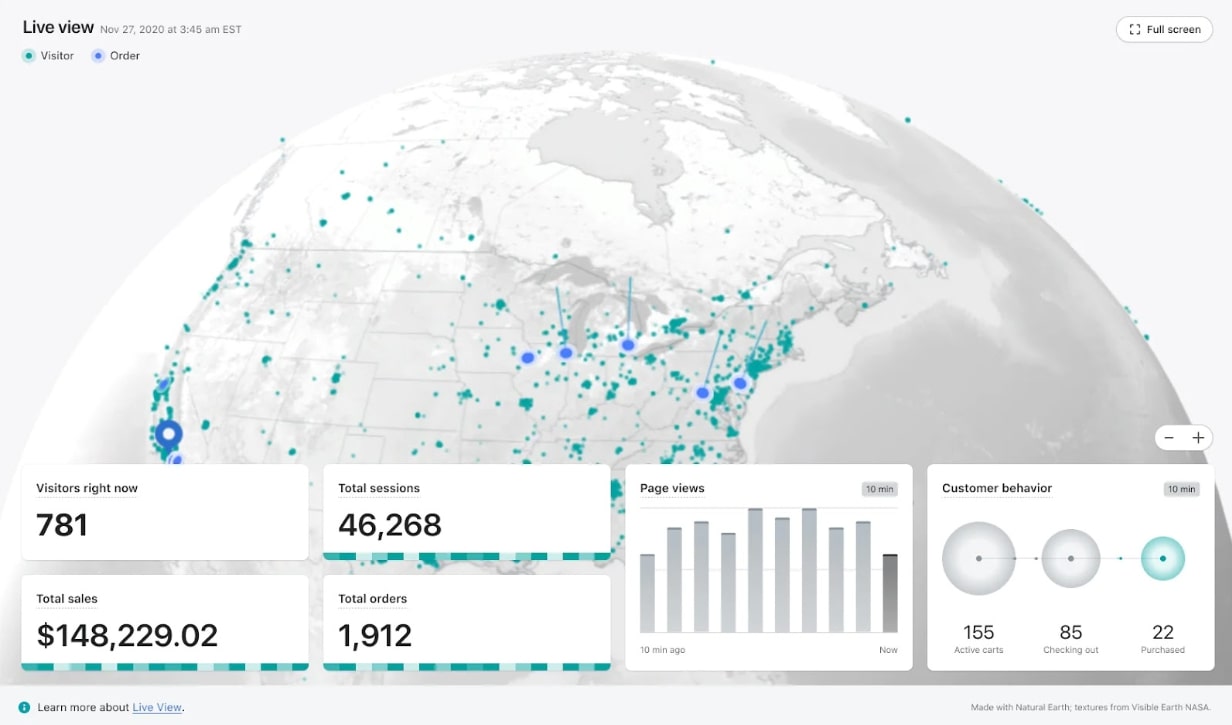
Live View shows ecommerce managers what’s happening on their online store right now. It includes a two-dimensional world map as well as a three-dimensional globe, so they can see exactly where visits are coming from in real time. This comes in useful during high-traffic periods such as Black Friday, when ecommerce businesses want to see the immediate effects of their campaigns.
Live View isn’t just a visual gimmick, either. It’s highly interactive, allowing users to:
- Toggle between views of the map vs. the globe
- Rotate the globe to see visits and orders happening live
- Click into visits or orders to see more information
- Zoom into a geographic area and search by city, region, or country
In comparison, the rest of Shopify’s data visualizations are pretty basic, presented mostly as line graphs. But as a result, it’s very clear and easy to navigate. Plus, hovering over different elements brings up a popover describing the information, which is especially valuable for team members who don’t have data backgrounds.
7. HubSpot
HubSpot is a CRM and marketing platform used by sales and marketing teams to manage campaigns, pipelines, and customer relationships. It's one of the more mature examples of analytics built into a SaaS product; the data has nowhere else to live, which means the reporting stays coherent without any extra effort.
What it does particularly well on the analytics front is keep data close to the work. The reporting lives in the same system as the contacts, the deals, and the emails, so numbers stay in sync as things change.
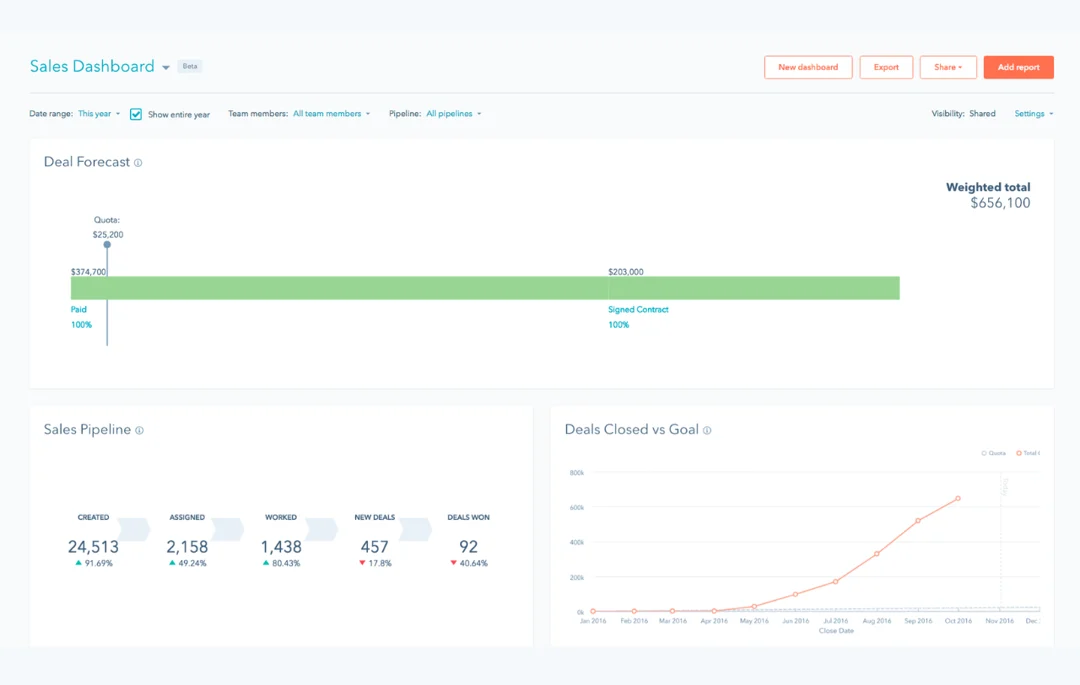
Sales teams can track pipeline health and progress toward goals at a glance. Marketing teams monitor lead sources, campaign performance, and conversion rates without switching tools. Dashboards are composable, allowing teams to combine the reports they need using a drag-and-drop editor. They can also build different views for different people, from individual contributors tracking their own activity to leadership dashboards covering the whole business.
HubSpot's permission model lets you set individual dashboards to public, private, or restricted to specific users and teams, so different people see different views of the same underlying data. That means sales reps see their own numbers while leadership sees the whole picture—in other words, governed self-serve working as it should.
Teams with more complex reporting needs sometimes find the native capabilities don't stretch far enough and end up supplementing with external BI tools. For straightforward sales and marketing analytics, though, it covers a lot of ground.
Want a deeper look at what makes a great dashboard? We’ve covered the key considerations for SaaS dashboard features in detail.
8. Linear
Linear is a project management tool built for software teams that has quietly become one of the cleaner examples of analytics done without excess.
Its Insights feature gives teams real-time visibility into how work is moving, with cycle time, lead time, issue count, effort distribution, and bug clearance all visualized directly inside the product without needing an export or a separate reporting tool.
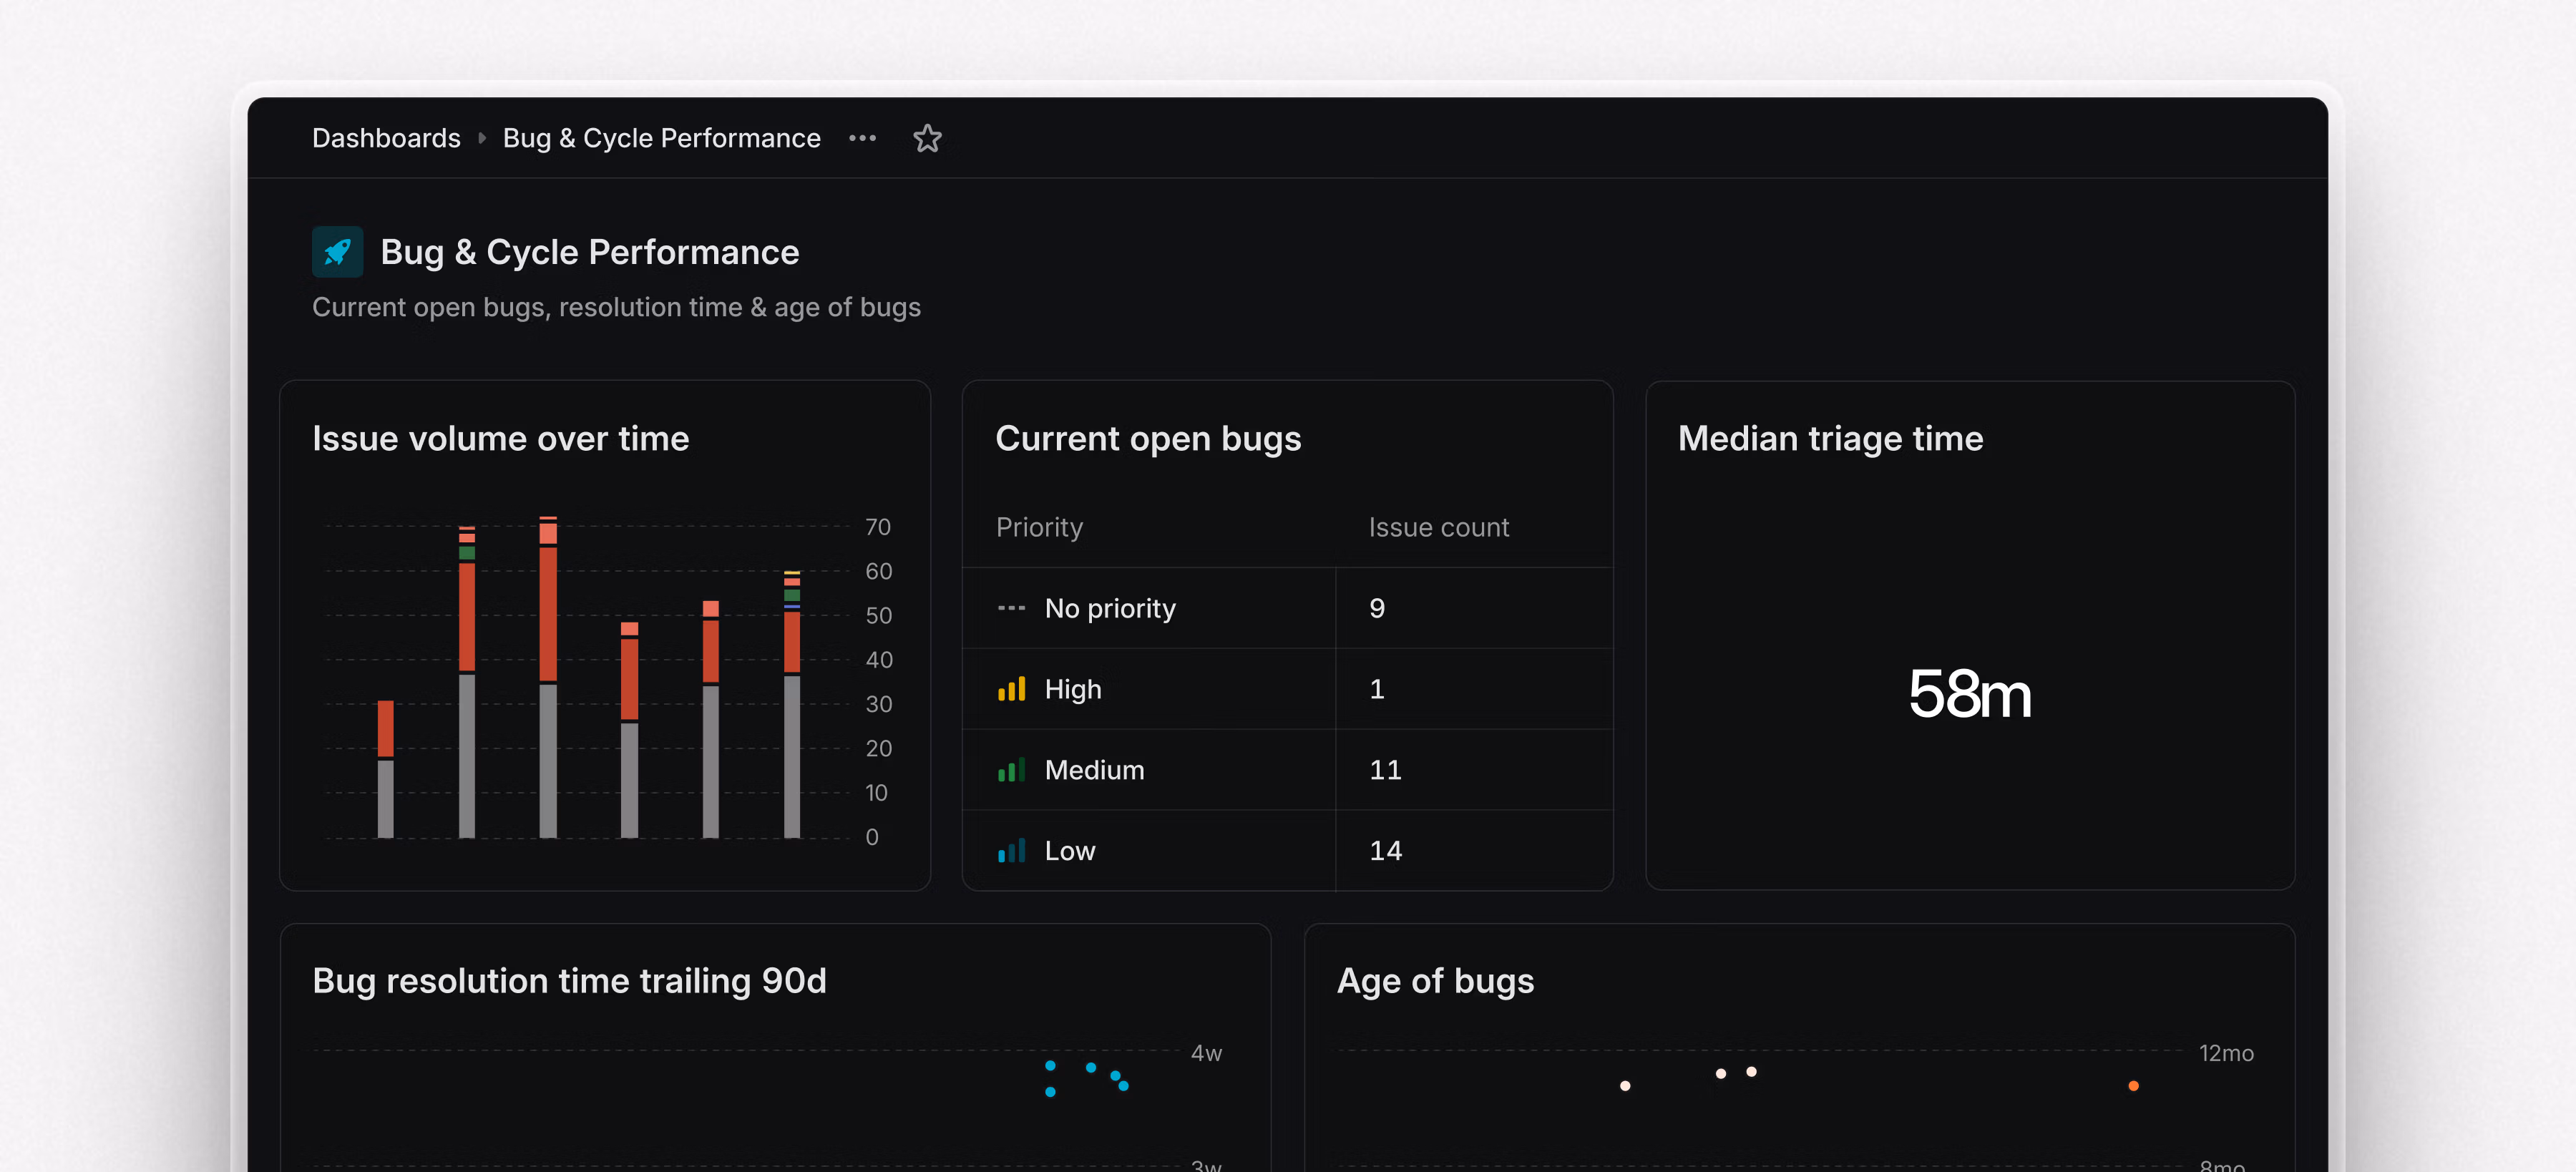
The design restraint is the key point to note. Linear’s strength is that instead of surfacing every possible metric, it highlights the insights that inform decision-making for engineering teams—where work is stacking up, whether bug clearance is improving, or how effort is being distributed across the team. Any data point can be drilled into to see the underlying issues, creating a direct path to action.
One limitation worth flagging is availability. Insights and Dashboards are typically tied to higher-tier plans, so smaller teams on entry-level pricing might not get access to the full analytics feature set. For teams that do have access, it's a strong example of analytics that feels like a natural part of the product rather than a reporting module bolted on at the end.
How to make the case for user-facing analytics
The benefits of user-facing analytics are often easier to see once the feature is live in the product. But getting customer-facing dashboards prioritized in your SaaS roadmap in the first place can be a trickier task. These use cases are designed to help you make the argument for these analytic capabilities in terms your team, your data function, and your commercial stakeholders will respond to.
Want to go deeper? We've also gathered lessons from user-facing analytics from teams who've been through the process.
Self-service data requests
Let’s face it, your data team is busy enough without handling every business intelligence query that comes in. One great benefit of building self-serve analytics into your app or website is that customers can find insights themselves, which reduces the number of data requests your internal team has to deal with and allows them to focus on more important tasks.
Let’s say one of your external stakeholders is a supply chain logistics partner. Giving them access to certain levels of self-service analytics means they can now access historical shipping data, inventory levels, and shipping schedules to make quick data-driven decisions when route planning—without adding to your data team’s workloads.
Customer activity summaries
It’s common for B2B SaaS apps to use data visualizations to summarize customer activity so their customers can see exactly what value they’re getting from the platform. This means customers are more informed and their processes are more efficient.
For example, if your product is a booking app for short-term rentals, you could show vendors stats like number of booked rooms, revenue, referrals, and repeat guests. Giving them access to this information shows them how much business they’re driving through your platform. It also empowers them to think of ways to increase their engagement and make data-driven insights work for their business—like where to focus their marketing efforts.
Embedded website statistics
Adding embedded analytics to your website to showcase real-time statistics about your product or service has two interesting benefits. One, your site becomes more dynamic and engaging thanks to increased sense of transparency and recency. Two, you get to communicate key things about your brand, such as performance stats or brand values.
Let’s take an “eco-friendly” ecommerce business as an example. By showcasing stats like “liters of water saved” or “carbon emissions reduced,” it bolsters its own reputation as a sustainable brand while showcasing the positive impact of the customer’s choices.
How Embeddable can help you build remarkable customer-facing analytics
We’d be willing to bet that the analytics solutions above were built from scratch. You don’t get Stripe-levels of report customization from embedding a dashboard from your existing BI tool or buying out-of-the-box SaaS analytics platforms.
That seems to be the catch-22: You either need to spend multiple sprints to get your analytics solution ready to launch or settle for something inflexible that loads slowly and doesn’t match the rest of your in-app experience.
But there’s actually a third way: Embeddable, a JavaScript SDK you can use to build your own customer-facing analytics, exactly the way you want them, but in 10% of the time. It combines your favorite charting libraries with your existing components, like dropdowns, to build embeddable analytics that match your brand experience.
With Embeddable, you choose which data models to make available to your customers on your product. This makes your data always updated, fast-loading, interactive, and engaging. So, if you didn’t think you could prioritize building your own customer-facing analytics just yet, we can help you get there faster.
Flexible, custom, and consistent: The hallmarks of great customer-facing analytics
If you’ve been pushing user-facing analytics further down the backlog for months, you know how valuable this feature could be. However, you’ve yet to find a solution to deliver it in a way that meets the customer’s needs and doesn’t delay everything else you want to build for them.
The best examples of customer-facing analytics we’ve seen have two things in common:
-
They’re easy to use and highly flexible: Rather than a few static charts and performance metrics, these solutions give users the option to filter and search data in different formats to get the information they need.
-
They look great and reflect the app’s branding: These solutions deliver a consistent brand experience with simple user interfaces and engaging visualizations. Overall an awesome user experience.
Usually, delivering this level of quality really means building the analytics components into your app yourself. Embedding a third-party solution just doesn’t give you the same user experience. But you could cut development time and deliver something remarkable with Embeddable: A front-end toolkit, backend engine, and no-code builder for full-custom user-facing analytics. Try Embeddable to take user-facing analytics out of your backlog and move it into production without hassle.
Want to learn more about building engaging, useful customer-facing analytics experiences? We've written an article about the design principles to consider for charts and dashboards.
Frequently asked questions about user-facing analytics examples
What is user-facing analytics?
User-facing analytics is data your customers can access and explore directly inside your product. It’s usually organized and visualized using charts, graphs, and other data visualization tools, and embedded in the app experience where users work. It's different from user analytics, which is an internal method of tracking how people use your product. User-facing analytics is outward-looking—data you put in your customers' hands so they can make better decisions with it.
What does "user-facing" mean?
User-facing refers to anything in a product that is visible and accessible to end users—the people actually using the software, rather than the team building or maintaining it. User-facing analytics, therefore, is the data experience you build for your customers, not the internal dashboards your team uses to monitor the product.
What are user-facing applications?
User-facing applications are software products designed to be used directly by end users or customers. SaaS products are a common example. They’re designed for the people paying to use them, not just the teams running them. Many user-facing applications have built-in embedded analytics features, giving customers access to their own data without leaving the product.
What is the difference between internal and customer-facing analytics?
Internal analytics stays inside your organization, covering usage analytics, conversion rates, and operational dashboards that help your team understand how the product is performing. Customer-facing analytics flips that around, surfacing data to your customers so they can understand how they're performing within your product. The two have different audiences, different data, and very different design requirements. Internal dashboards can be functional and rough around the edges. Customer-facing analytics needs to feel native, governed, and polished as part of your product experience.
What is self-serve analytics?
Self-serve analytics gives users the ability to explore data themselves, without needing to raise a request with a data team, by filtering, adjusting, and querying. In the context of customer-facing analytics, it means your customers can find the answers they need on their own, in your product, without waiting on anyone. Done well, it can reduce internal data requests while increasing the perceived value of your platform.
How do you add user-facing analytics to a SaaS app?
There are three approaches to embedding user-facing analytics in your app:
-
Building it yourself. Some companies choose to code their own user-facing analytics solution. This is best suited to projects with larger budgets and in-house engineering talent. It results in very custom solutions but it can eat up a lot of dev time and resources.
-
Using a third-party BI tool. If building it yourself sounds too complex or expensive, you can either embed your existing BI dashboard or go for an out-of-the-box user-facing analytics solution. Typically, the drawbacks are poor loading performance,limited customization, and little to no white-label analytics capability. The components are pretty basic and it won’t deliver the same brand experience as the rest of your app.
-
Embeddable. For the best of both worlds, you can try a purpose-built embedded analytics platform like Embeddable. It combines a front-end toolkit, back-end engine, and no-code builder for user-facing analytics—giving you fully custom analytics dashboards without the launch times or the price tag of building everything from scratch. Learn more.
You can read more about building customer facing analytics and the customer dashboards build or buy decision in detail.