.jpg)


88%* of customers wouldn’t return to a site where they had a poor experience. This makes design crucial for teams aiming to improve user adoption and retention.
When designing dashboards and data visualizations, especially for Embedded Analytics experiences, it can be particularly challenging to strike a balance between creating aesthetically pleasing and easy-to-read graphs.
Since business data is inherently complex and your customers will often need to make quick, informed decisions, knowing how to present data in a simple way will help set you apart from competitors. That's why designing an interactive, visual dashboard with real-time data is invaluable.
In this article, you’ll find five important dashboard design principles and considerations recommended by Harry Marshall, Co-founder of Embeddable. Then, discover how Embeddable can help you build a successful dashboard in just a fraction of the time.
Build remarkable analytics experiences in just 10% of the time with Embeddable.
* The Trillion Dollar UX Problem: A Comprehensive Guide to the ROI of UX
Why is data visualization important?
There are loads of benefits to customer-facing analytics, starting with increasing your product’s real and perceived value. Presenting data in a visually appealing way can make your customers spend more time on your platform, gain insights, recommend it to others, and make data-informed decisions.
“Adding data visualization to your app can enable your customers to make better-informed decisions, which increases the value of your product or service to them,” says Harry Marshall, Co-founder and COO at Embeddable. “In turn, this allows you to increase engagement, retention, referrals, and even create upsell opportunities.” But that’s not all, here’s why great data visualization matters:
- Raw data is hard to process. Visualizations simplify complex data, which is especially important for B2B use cases. Your customers might need to make quick decisions based on large sets of historical data. A few well-presented charts and graphs will make that process faster and easier.
- Visual media is more engaging. People are drawn to more visual media, especially when it’s interactive. Providing users with a visual user-facing analytics experience that they can tweak and browse according to their needs will increase engagement with your app. If that process is intuitive and helps them make informed decisions, you’ll see customer satisfaction rise.
- Users may be willing to pay. If customers have a critical use for data, they’ll likely pay more for well-designed dashboards. You could find opportunities to upsell data analytics through tiered pricing plans and add-ons. But users will only see the value in this if your SaaS dashboards are visually appealing and satisfy their genuine needs.
Ultimately, well-designed and interactive dashboards will help users gain insights, make informed decisions, and reach better results.
5 important dashboard design considerations
The best examples of user-facing analytics combine simplicity with flexibility, giving users exactly what they need to absorb information quickly, drill down into areas of interest, and take action based on their findings. Keep the following considerations in mind to help you design a successful dashboard.
Check out our review of some excellent examples of customer-facing analytics here.
1. Every chart should provide actionable data
For a dashboard to deliver the most value to its users, it can’t exist for curiosity’s sake alone. It should drive action, allowing users to look deeper into what they see and draw conclusions. To make a dashboard actionable, it’s important to understand what it’ll be used for, who it will serve, and what their goals are. These tips will help create more audience-specific, actionable dashboards:
- Use the Jobs to Be Done (JTBD) framework. People buy products to get jobs done. To make that happen, your team needs to know the users’ goals and context. Why are they using the dashboard? What circumstances led them here? Knowing this will help personalize features and functionality to their needs. For example, users who want to dig into data will need more drill-down capabilities than those looking for quick insights.
- Highlight essential metrics. Including every possible stat or metric could be ‘information overload’. Now you’ve considered JTBD, you know what users are really interested in. Save them time with visual cues like chart size and positioning. Typically, our eyes are drawn to the top left corner of a web page, so this is where critical metrics should be found.
- Optimize for technical vs. non-technical users. Technical users might look for more advanced features like custom scripting or SQL query integration. However, if you’re designing for a non-technical user, keep things simple. They might appreciate natural language search capabilities as well as drag-and-drop dashboard widgets.
- Internationalize if needed. If you have a global audience, be prepared to internationalize for differences like date and number formatting. Proper character coding (e.g. UTF-8) supports various languages and special characters. You can also include user-facing customization features to allow people to choose their own language and formatting.
- Keep it simple. This doesn't mean being boring or flat; instead, it means ensuring that the charts are first useful and readable, and then visually appealing. Your unique branding is one of the things that sets you apart from competitors, but designing an original graph that's very hard to read isn't the solution. Ask yourself and others on your team: Can you read this graph? What insights can you gather from a quick glance at it?
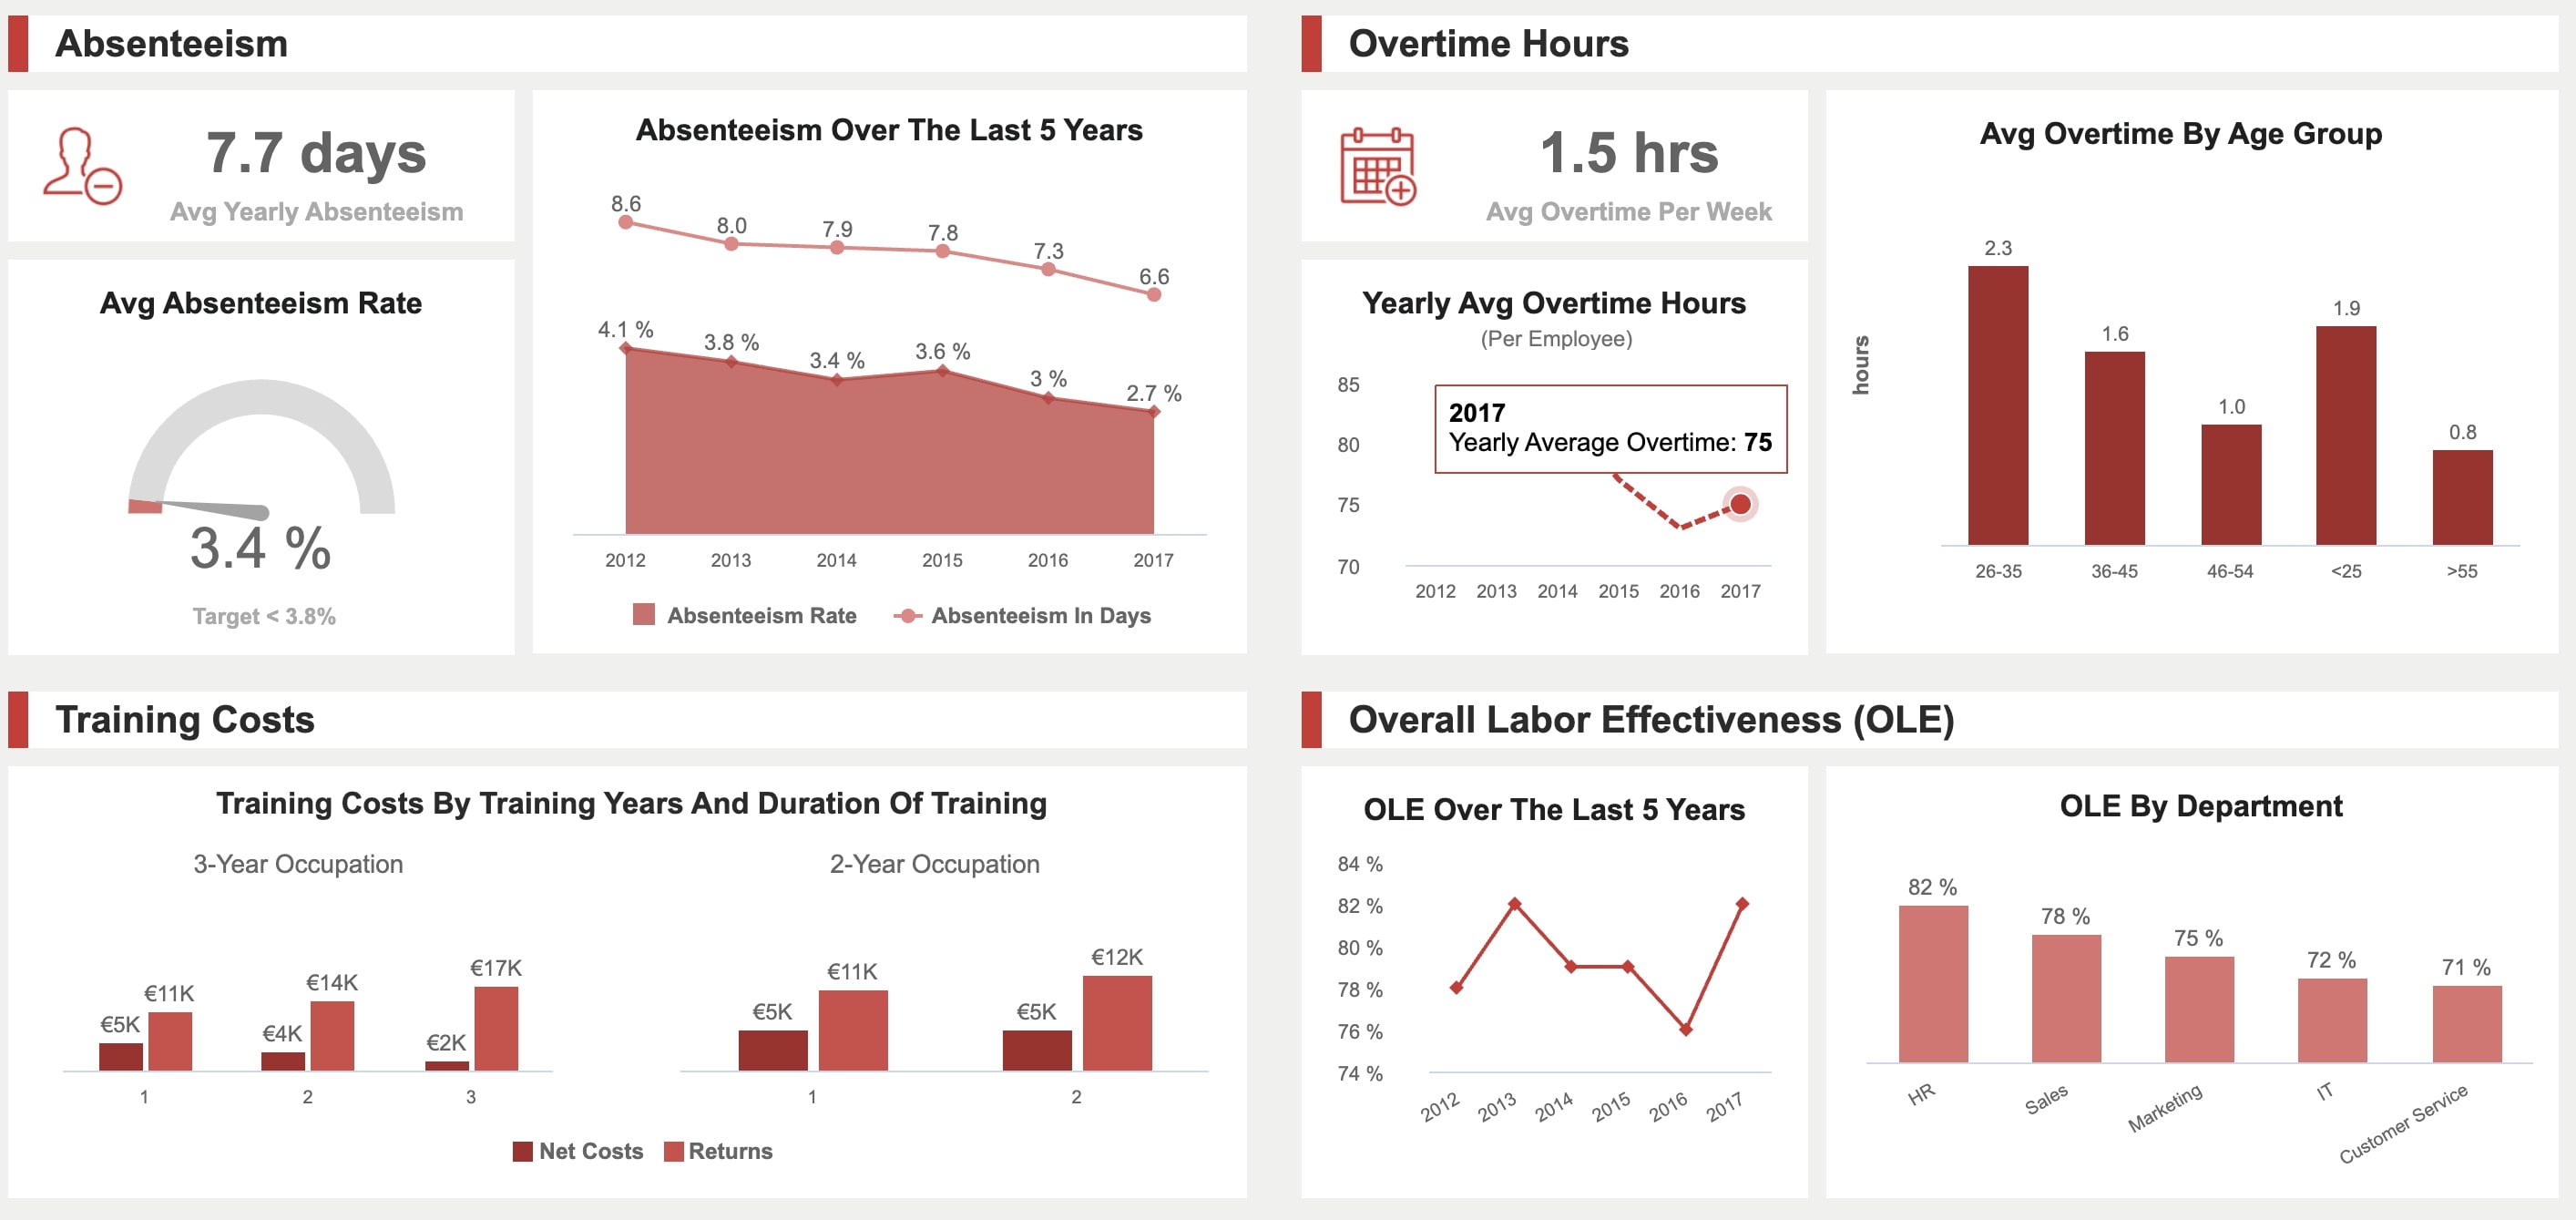
In the dashboard below, absenteeism rates and overtime hours are highly visible. This type of dashboard would be suited to a People team that hopes to increase employee engagement and reduce burnout. It may not be as effective for a more technical team that wanted to explore the data in-depth, though, because it doesn’t have any filtering options.
Still, when used by HR teams, such dashboards can support decisions around employee rewards and recognition by highlighting patterns that deserve acknowledgment or improvement.
2. Graphical integrity inspires trust
Designing a dashboard isn’t just about making data look cool... It’s also important to give users confidence in the accuracy of the figures they see. Without trust, building a dashboard is a waste of your and dev’s time, since it won’t efficiently deliver value.
Developers will, of course, build validation rules and data quality checks to ensure data integrity. But there are also a few ways to ensure graphical integrity, to stay objective and avoid presenting data in a way that unfairly influences analysis. Do this by coming up with:
- Accurate data representation. When visualizing numbers, make sure the visuals are directly proportional to the figures represented. For example, if a bar chart shows values of $145k and $50k, the second bar shouldn’t be half the size of the first bar, as that wouldn’t be accurate. This could make the user mistrust your data.
- Clear definitions for metrics. Charts should be labeled clearly and accurately while keeping it concise. Take a look at the example below. The labels ‘Year one’, ‘Year two’ and so on. don’t actually tell the user which year they’re looking at (i.e. 2020, 2021, etc.)
- Ways to validate or cross-reference data. Customers should be able to use filters or side-by-side charts to cross-reference data based on specific criteria. It helps to include timestamp and version history features. For advanced users, you could also give them the option to export data to perform their own analysis.
- Choose the right visualization type. Even the graph types that you choose can make data misleading. Pie charts, for example, can often be less clear than line charts. It’s better to repeat a visualization type rather than choose the wrong one.
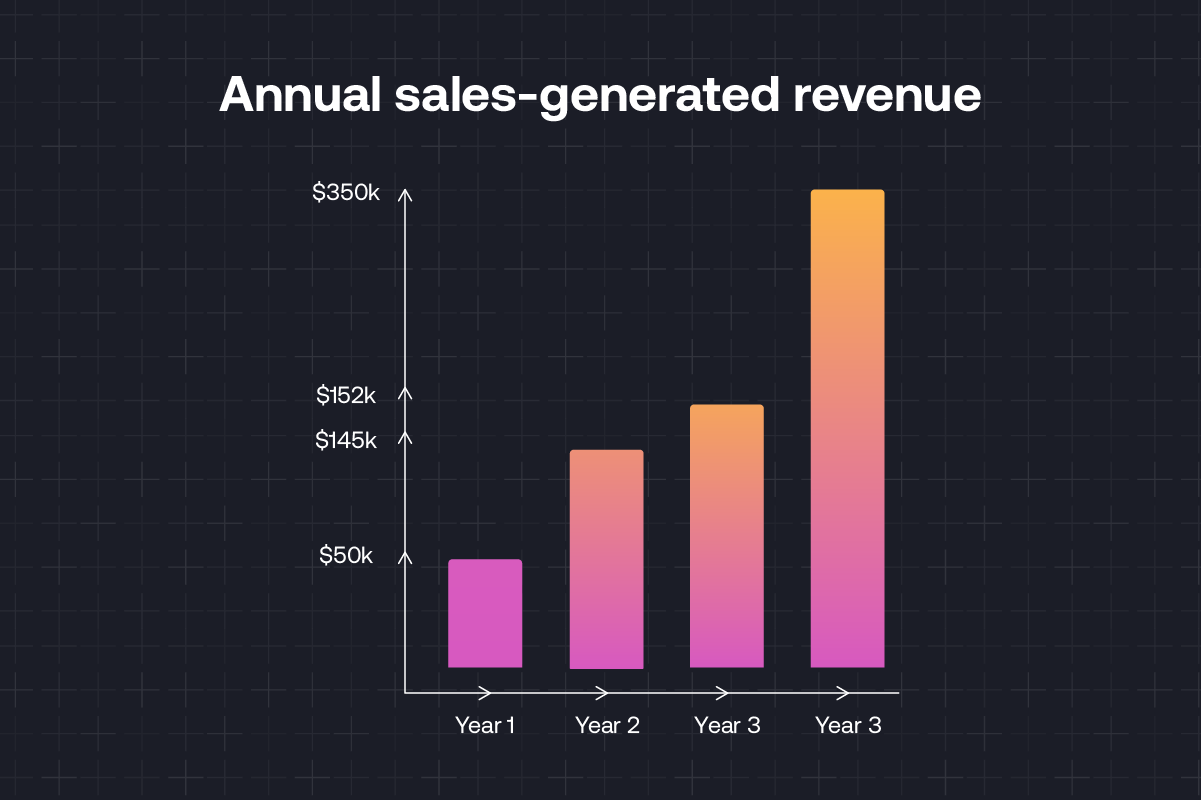
One thing this bar chart does right is round up the numerical values, even though that seems less accurate. Recognizing the value between two large numbers with a decimal point can be tricky. It’s easy to see that $152k is greater than $145k. But it’s less easy to see that when the figures are represented in full: $152,020.36 > $145,987.99. If you think some users may need the decimals, then consider showing them only if the user is hovering over the abbreviated datapoint—a concept called ‘progressive disclosure’.
Pro tip: For a more in-depth understanding of how design impacts graphical integrity, check out The Visual Display of Quantitative Information, by Edward Tufte.
3. A simple design improves clarity
When it comes to designing visual elements, simplicity is key. Your customers may already have a high cognitive load, so it’s best to avoid adding to that with complex, cluttered dashboards.
For example, text labels don’t have to be in black (or any dark color). Simply using a lighter shade will declutter the dashboard and place the emphasis on the charts themselves, making it easier to spot patterns in them.
Here are a few more tips for designing clear dashboards:
- Improve the data-ink ratio. “Ink” refers to any element on your dashboard, like text, charts, or icons. A good data-ink ratio means that everything on a dashboard directly communicates data to the user. Remove anything that clutters the dashboard, like unnecessary effects, icons, grid lines, or patterned backgrounds. All this “chart junk” makes it harder to interpret the data and could slow down your customers’ time-to-value. Instead, use plenty of white space to make charts easy to absorb.
- Use three colors, max. Using too many colors will make your dashboard look cluttered and confusing. Stick to three colors where possible and use different shades to show emphasis or variation. For example, you could use a darker shade of green to show increased volume, rather than switching between green and yellow.
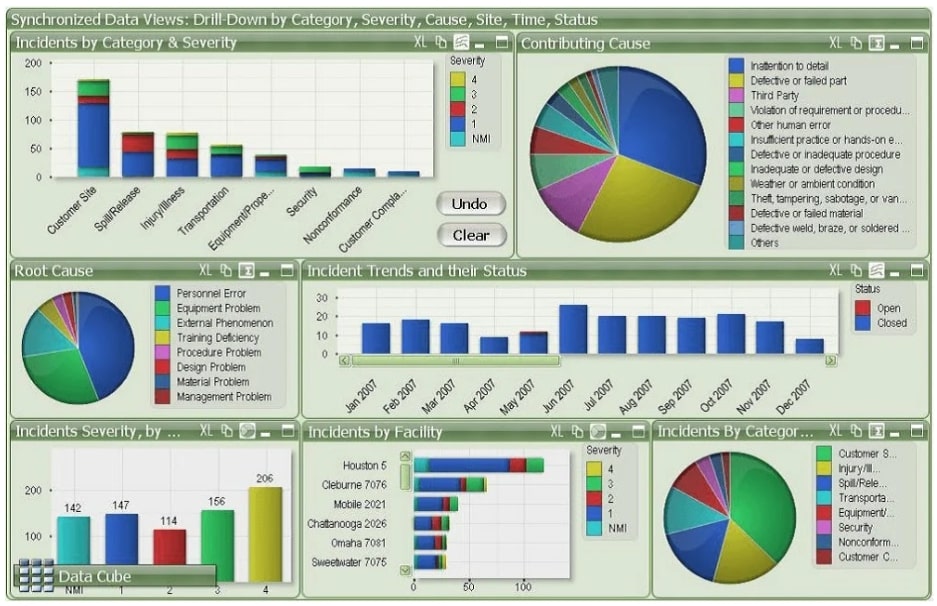
- Use color-grouping. Color can be used to show a relationship between two charts, which helps users find information and contextualize it more quickly. In the dashboard example below, you could group the ‘Incidents’ charts using shades of blue and the ‘Cause’ charts using multiple colors.
4. Interactivity is essential
Interactive features like drill-downs, click-to-filter, and time interval widgets are essential for a strong dashboard design.
“Our partners often tell us that delivering data in a clear and relevant way to their customers, with a considered level of available interactions (like data pickers and filtering) can have a huge impact on the value they deliver to their customers. However, it can be challenging to deliver that level of interactivity using embedded BI tools.” —Harry Marshall, COO at Embeddable
If the data is static, then customers are stuck with static answers, and they won’t be able to investigate deeply enough to find what they’re looking for. Which means more data requests for your BI team.
- Include popovers. The best charts adapt to provide additional context as users hover over different elements. You can use popovers to show data labels, highlight corresponding information in a key, or include tooltips. Remember to add code to close the popover when the user scrolls or clicks away!
- Conduct usability tests. Tools like UserTesting and Hotjar let you observe and interview potential users while they perform tasks using an MVP of your dashboard. This will show you which filtering features they’re looking for and which ones they skip over. Heuristic evaluation can also be used to test interactivity.
- Check loading speeds. A few vital interactivity features shouldn’t harm loading speeds but it’s still important to check. To enhance loading speed, minimize unnecessary animations, and reduce rendering bottlenecks by using efficient CSS or JavaScript code. You can also use lazy loading to conserve bandwidth.
Pro tip: The charting libraries you build with have an impact on how customizable your visuals are, so bear this in mind before you begin. A library like Tremor, for example, is simple to use but offers limited customization. Meanwhile, D3.js might have a steep learning curve but it offers way more chart flexibility and interactivity.
5. Accessibility shouldn’t be an afterthought
1 in 4 adults in the US have a disability. So, even if you’re not aware of any users with additional needs, it’s better to design with them in mind. Increasing the accessibility of your app means you won’t unknowingly turn someone away or negatively impact engagement.
Before you begin building, check out the Web Content Accessibility Guidelines (WCAG). You can reference the WCAG rating system during the design process. Otherwise, here are some quick tips:
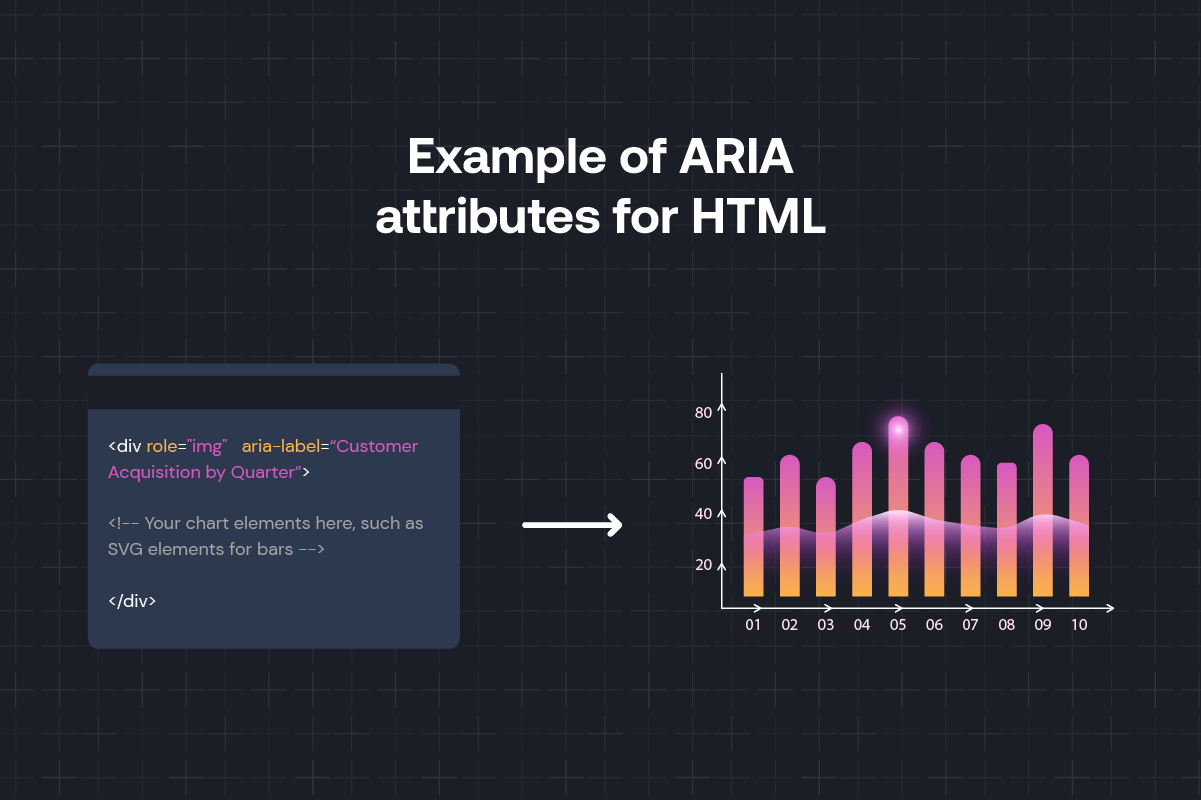
- Add ARIA attributes to HTML. ARIA stands for Accessible Rich Internet Applications. It can be used to make web content more accessible to people who use screen readers or other assistive technologies. Add attributes like ‘role’ to define the purpose of the element, and ‘aria-label’ to give a text-based description of its content.
- Optimize for different devices. Some users may not be able to sit at a typical desktop. Pick a data visualization library that has been tested across Android and iOS as well as a range of browsers and hardware. That way, users with different accessibility needs will be able to access their analytics in the way that suits them.
- Use sans serif fonts. Sans serif fonts are simpler and easier to read. Using them for dashboard headers and labels can help most users, but especially those with dyslexia, to process the information more easily. Avoid using italics or underlines as this can make words run together and seem illegible to certain users (bold text is best for emphasis).
- Test with screen readers. When testing your dashboard, remember to use screen reader software to ensure that all elements can be accessed and understood. You could even conduct usability tests with people who have a range of disabilities to identify any other issues with your design.
- Use color contrast analyzers. People with low vision or color blindness can be supported with the right color contrast ratio. According to WCAG, the recommended contrast ratio is a minimum of 4.5:1 for any text that’s 18pt (24px) or smaller.
How Embeddable can help you design customer-facing dashboards
A lot of work goes into building a great dashboard from scratch. We know this first-hand (before Embeddable, we built countless dashboards with Trevor.io). But you’ll never get the same user experience with traditional embedded analytics tools. Out-of-the-box solutions don’t have the customization level you need for truly effective dashboard design that answers all your users’ needs.
That’s why we built Embeddable. It combines a front-end toolkit, backend engine, and no-code builder that lets you build fully custom analytics experiences for your customers—without the cost of building from scratch.
When you use our frontend toolkit alongside open-source charting libraries like Tremor or Google Charts, developing each charting component becomes much faster. Our backend engine connects to your database using a secure read-only transaction, while you get to customize the caching refresh rate to maintain a high performance. And, when you’ve done the basics, non-technical users can do the rest using a no-code builder, meaning they can add exactly the charts they need—without additional support from your team.
Check out the code for building with Embeddable: Read developer docs
Build simple, stunning dashboards that drive action
A good dashboard displays relevant information that supports the end-users to make decisions and take action. These dashboard design tips will help you build dashboards your users trust and keep coming back to:
- Use the JTBD framework. Every chart should be highly relevant to the audience and help them complete the tasks on their to-do list.
- Improve data-ink ratio. There should be nothing on your dashboard that doesn’t communicate information. Reducing “chart junk” like graph lines and unnecessary animations means users will find it easy to find the data they need and spot patterns.
- Add interactive features. If users can dig into the data with drill-downs, filtering, and informational popovers, they’re more likely to get the answers they need without asking your internal data team.
- Test with a range of users. Include people with disabilities and those who use assistive technologies in your user testing pool. That way, you’ll know if there are any accessibility issues with your dashboard.
We know how complex it is to build analytics into your app. That’s why we built Embeddable, your toolkit for building totally custom, interactive dashboards more quickly. With Embeddable, your users get the remarkable analytics experiences they’ve been waiting for.
Build remarkable analytics experiences in just 10% of the time with Embeddable.
Frequently asked questions about how to design dashboards
What’s the best way to design a dashboard?
The best way to design a dashboard is by making it as clear, simple, and user-centric as possible. Here’s how:
- Get to know your target audience. The dashboard should only include charts that directly support users with their jobs-to-be-done (JTBD). Your users’ technical background should also be a consideration. If they’re non-technical, make sure they can use the dashboard without coding.
- Use a logical dashboard layout. Group charts together based on their content and purpose. The most important metrics should be in the top left corner of the screen, as this is typically where most people’s eyes are drawn. Colors can also be used to signify relationships between charts or highlight positive/negative results.
- Get user feedback. Conduct usability testing with your target audience to make sure the dashboard satisfies their needs. This work will be ongoing even after launch, so expect to gather feedback and iterate on your design throughout the product lifecycle.
What are dashboard design best practices?
The best practice for creating dashboards is to visualize data in a simple way that drives action. For that reason, dashboards should be designed with the users’ JTBD in mind, giving them actionable insights that support their decision-making. Charting components should be interactive, allowing users to drill down and filter data according to their needs. Finally, it’s important to ensure data integrity by building charts that represent data accurately, without bias.
What’s the 5-second rule for dashboards?
The five-second rule for dashboards is intended as a guideline to ensure that charts load quickly (in five seconds or less). Analytics dashboards often help stakeholders make critical decisions, so they need to be fast-loading and easy to interact with. Cut unnecessary elements like animations and complex visuals to improve your site’s loading times.