Metabase vs Tableau: Which BI Tool to Use?
We compare Metabase vs Tableau: key features, pricing, data visualization, the ease of embedding and more.
Summarize with:
If you’ve already made the decision to use OEM analytics instead of building out embedded dashboards on your own, you’ll be faced with another dilemma. You can opt for a traditional BI tool with embedded features, such as Tableau, or an embedded-first platform such as Metabase.
Metabase is a newer, smaller tool offering competitive, transparent pricing and an intuitive interface. On the other hand, Tableau is a market leader with excellent data visualization capabilities and real-time data analysis.
Today, we compare them to help you make the right call.
Metabase and Tableau at a glance
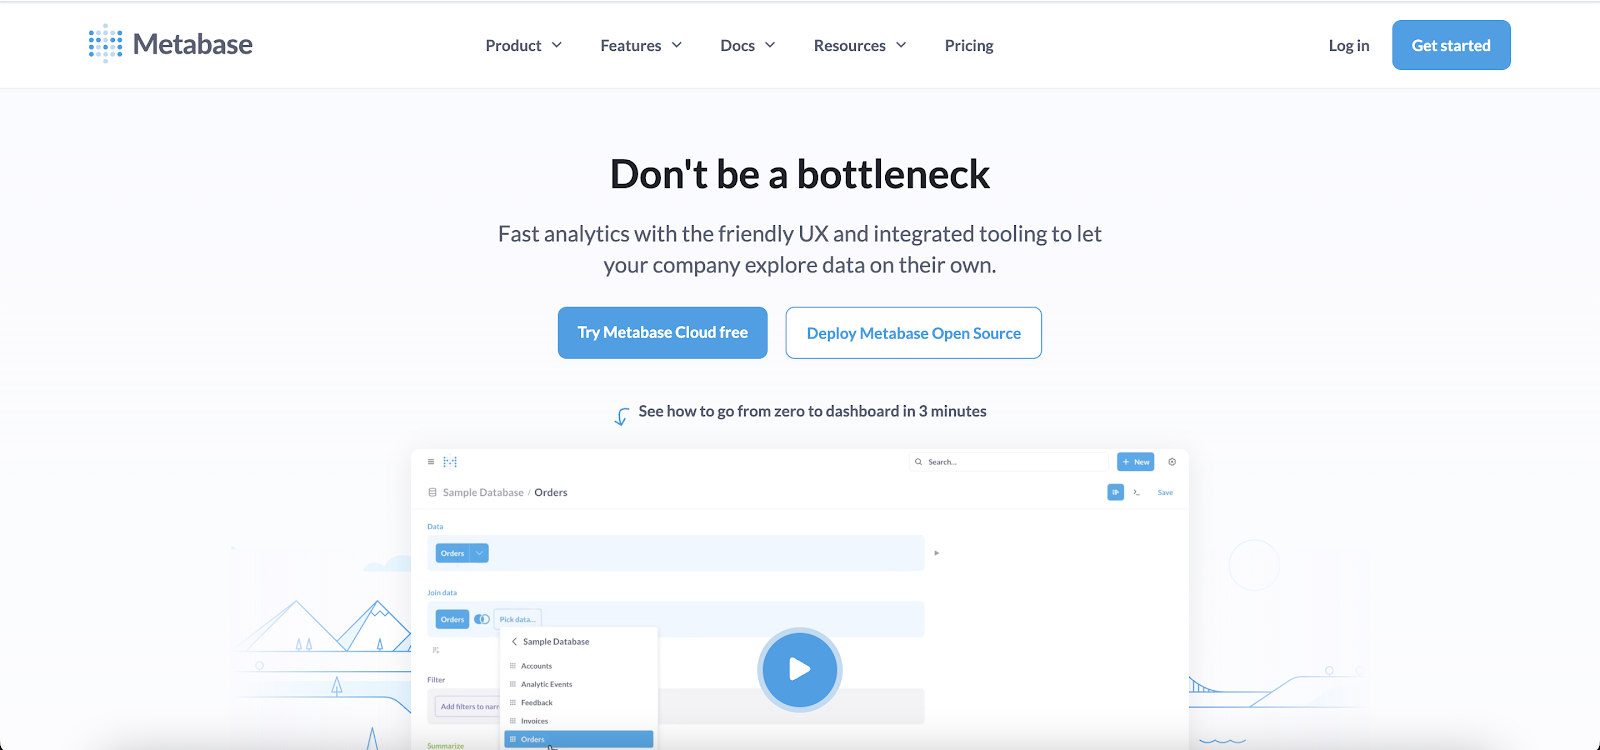
Metabase is an open-source BI tool designed for simplicity and quick setup. It lets teams quickly build and embed basic dashboards, which makes it popular with startups and SMBs looking for a no-frills solution, e.g, for OEM analytics.
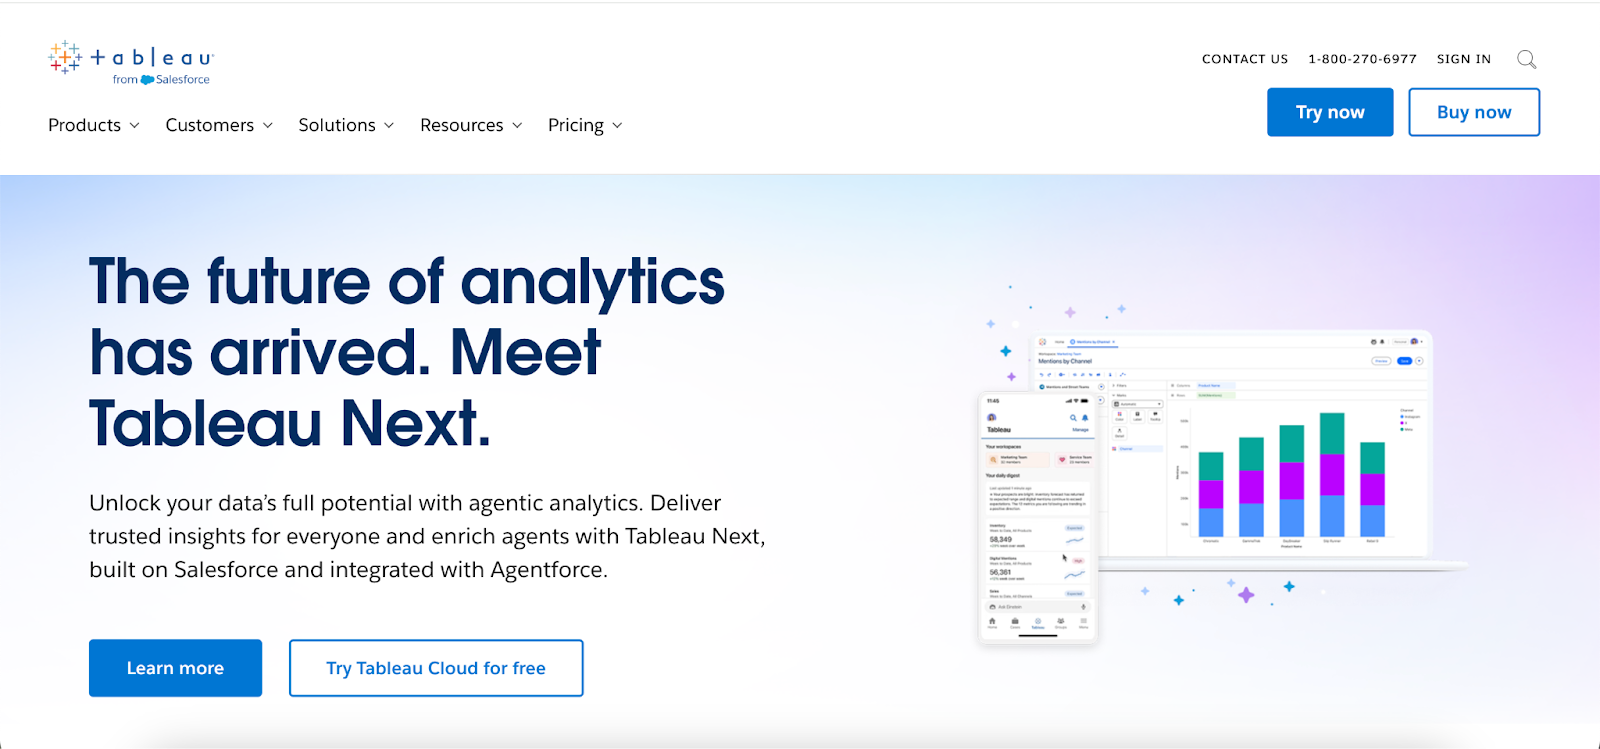
Tableau, on the other hand, is a long-standing leader in data visualization and business intelligence. Now part of Salesforce, it provides a comprehensive suite for analysis, rich visualizations, and sharing insights at scale.
Both let you create interactive dashboards to help you make data driven decisions, but there are key differences which make them suitable for completely different target audiences.
Metabase vs Tableau: user interface and experience
Both of these BI tools offer robust features for turning your organization's data into actionable insights. However, regarding the user interface, key features, and overall experience, one of them provides a much gentler learning curve for newcomers, as you don't need deep technical expertise to analyze data and get to deeper insights from simple data sets.
Let’s compare how easy they are to use and what advanced functionality each supports.
Ease of use and interface design
Metabase gets a lot of praise for its clean, user-friendly interface that prioritizes simplicity. The design is minimalist in this business intelligence tool – when you log in, you get a straightforward web dashboard where you can browse data, run queries, and view charts without feeling overwhelmed by options.
This makes it easy for non-technical users to start exploring data after very little training. The learning curve is gentle; many basic tasks (like running simple reports or building a dashboard of key metrics for further data analysis) can be accomplished without a dedicated BI developer, large data teams or extensive documentation.
Tableau’s interface is powerful but more complex. Most users create visualizations using Tableau Desktop (a separate BI tool for Windows and Mac) or via Tableau’s web editing interface. Tableau provides a rich drag-and-drop experience – you connect to a data source and then drag fields onto a canvas to create charts.
That said, new users still typically need some time (and perhaps training) to learn how to add data, define calculations, and effectively use various visualization options. The first hour with Tableau might be intuitive – dragging and dropping to make a bar chart – but mastering its full capability can take weeks or months.
Customizability and advanced features in the UI
When it comes to customizing the user experience and accommodating advanced use cases, Tableau tends to have the upper hand.
The platform is loaded with advanced features for those who need them. For example, in Tableau you can create complex calculated fields using a formula language, build interactive dashboard actions (like filtering one chart by clicking another), and design fully custom dashboard layouts.
Metabase, by design, focuses on the essentials of querying and visualization rather than deep customization. Out of the box, you get the core functionality needed to ask questions and make charts from your data. You can write SQL queries in Metabase (there’s an SQL editor for those who prefer full control), and you can join tables or define simple custom fields through the GUI.
However, Metabase doesn’t have an elaborate built-in data modeling layer or a long list of advanced chart settings – it assumes that if you need very complex transformations such as predictive modeling, you’ll handle those in your database or data warehouse before bringing the data into Metabase.
The upside is that the interface stays simple. The downside is that highly specific customizations (for example, custom tooltips with conditional logic, multi-step drill-through actions, or intricate theming) aren’t really possible in Metabase’s UI.
Data visualization capabilities
Both Metabase and Tableau enable business users to create charts, reports, and dashboards to visualize data, but they differ significantly in how extensive and sophisticated their visualization options are. Both are preferred data tools for large audiences, but they are very different in how they visualize data.
Visualization options and chart types
Metabase covers the basic visualization needs for standard dashboards. It comes with a selection of more than a dozen common chart types out of the box.
This includes the staples: bar charts, line charts, area charts, pie charts, scatter plots, tables, and simple maps. These chart types are usually enough to represent key metrics and trends for many business use cases.
However, Metabase’s visualization library is not as extensive as Tableau’s. It focuses on the essentials and omits many of the niche or advanced chart types. If you need a funnel chart to show stages in a pipeline, a gauge or speedometer chart, a bullet chart, or a complex treemap, you won’t find those in Metabase’s native options. You might have to get creative (or export data to another tool) for highly specialized visuals.
One of Tableau’s strongest selling points is its visualization capabilities. Tableau offers a very wide range of chart types and visual elements. Out of the box, Tableau can produce everything Metabase can (bar, line, pie, tables, scatter, maps, etc.) and many more.
For example, Tableau easily creates heat maps, tree maps, bubble charts, histograms, box-and-whisker plots, Gantt charts, bullet graphs, and combined charts (like bar-over-line charts).
In terms of variety, Tableau’s visual library is far ahead – it provides “numerous pre-built charts and interactive features” for data visualization.
Interactivity and drill-down features
Modern BI tools don’t just create static charts – they allow users to interact with the data and in many cases, do complex data analysis. Both Metabase and Tableau support interactivity in their dashboards, but the depth of that interactivity differs.
In Metabase, interactivity is available but relatively basic. You can add dashboard-level filters and variables – for example, a date filter that applies to all charts on the dashboard, or a dropdown filter to select a product category which updates multiple visuals at once.
This allows end users to do simple data exploration through slicing and dicing, such as filtering to a specific date range or category.
Tableau is well known for its rich interactive features. Dashboards in Tableau are inherently interactive and allow for intuitive data exploration. When you publish a dashboard, users viewing it can click on elements, and the tool can respond dynamically.
Metabase vs tableau: pricing
One of the biggest differences between Metabase and Tableau lies in their pricing models and cost of ownership. Metabase’s core software can be used for free, whereas Tableau is a commercial product from the get-go. Here’s how the pricing breaks down for each, and what that means in different scenarios.
Metabase pricing
Metabase is an open-source project, which means the software itself is free to use under the appropriate license. You can download a Metabase instance and deploy it on your own infrastructure without paying any licensing fees.
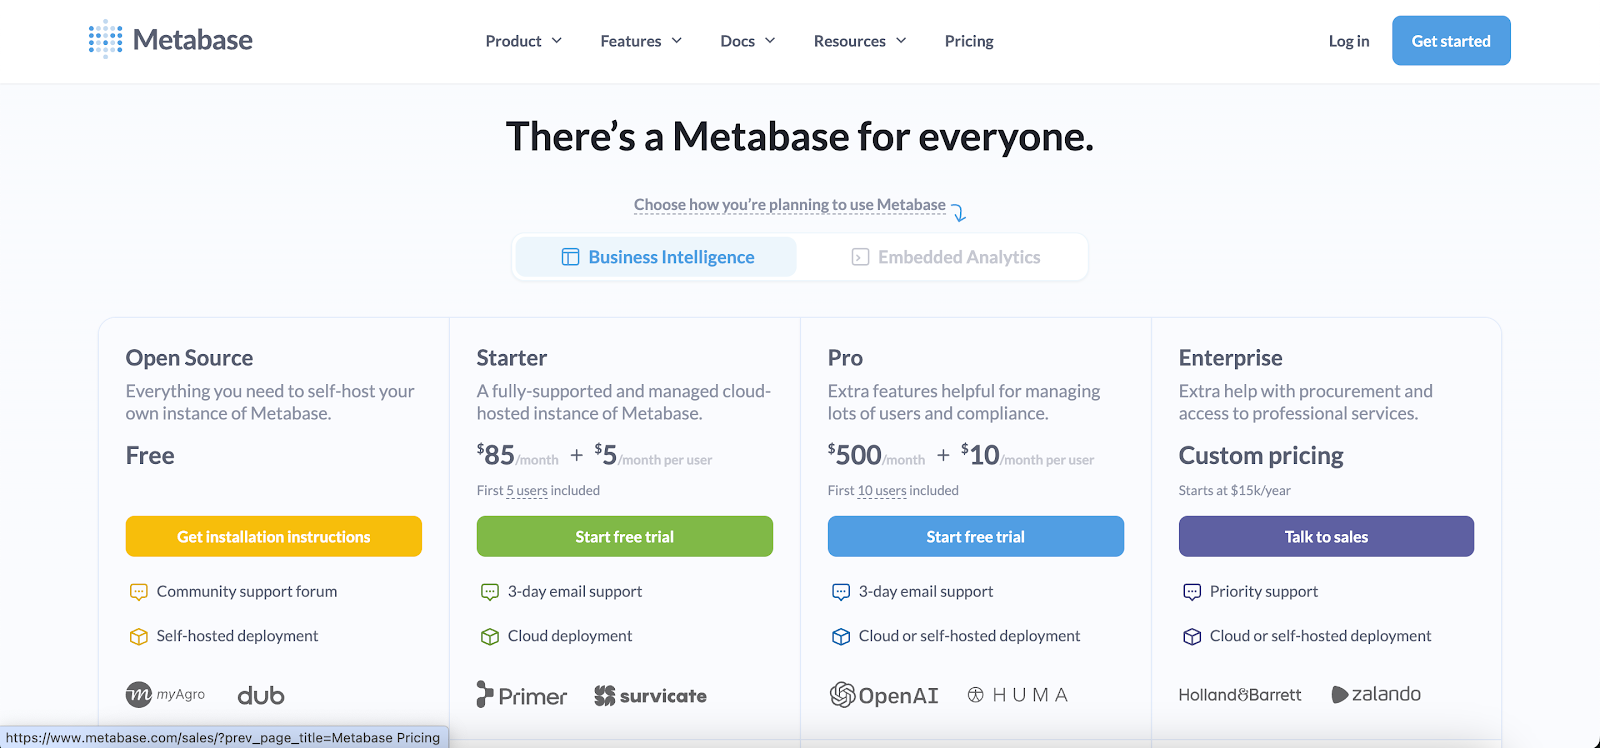
In addition to the free version, Metabase offers paid plans for added features and hosting convenience. Metabase provides a cloud-hosted service and enterprise editions with extra functionality. According to Metabase’s official pricing, the Pro plan (their lower-tier paid offering) starts at around $500 per month for up to 10 users.
Metabase’s pricing does not depend on how much data you have or how many dashboards you create – it’s generally based on user count and feature tier. Unlimited viewers can access a self-hosted Metabase for free, which is very attractive if you have a broad audience, but you have to support it yourself and it will come with a Metabase logo - which may not be ideal if you’re embedding it. If you go with the paid plans, the cost grows as you add more users.
Tableau pricing
Tableau’s pricing is more complex and significantly higher per user than Metabase’s. Tableau is a commercial product with no free self-hosted edition equivalent to Metabase’s open source version. (There is Tableau Public, a free platform, but it only allows you to publish dashboards publicly for anyone to see – it’s not suitable for private business data or embedding in a private app.)
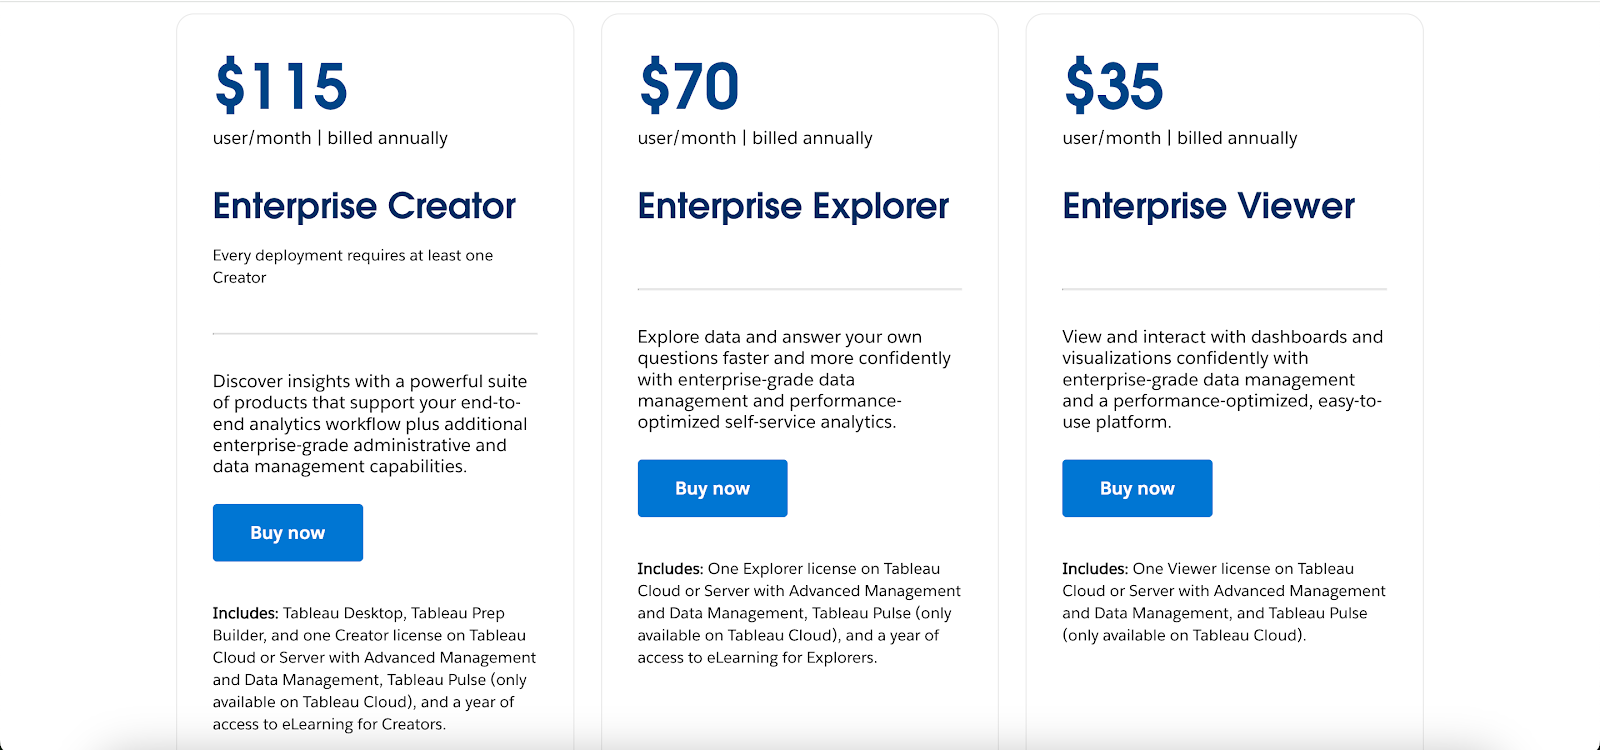
For professional use, Tableau offers role-based licenses on either Tableau Cloud (Tableau’s hosted SaaS) or Tableau Server (self-managed). The primary license types are Creator, Explorer, and Viewer, each at different price points.
A Creator license – which is basically for power users who need to do everything (includes Tableau Desktop application, ability to publish and administrate) – costs roughly $70 per user per month (when billed annually)
For organizations that want to embed Tableau charts into a product for external customers, the standard user-based licensing can get very expensive.
Tableau recognizes this and offers embedded analytics licensing options. One way is a core-based (server) license, where instead of paying per user, you pay for a Tableau Server deployment based on the computing cores and that allows you to serve potentially unlimited users.
These core licenses often run in the tens of thousands of dollars and are used by enterprises (essentially an OEM model). More recently, Tableau (Salesforce) introduced a usage-based licensing model for Tableau Cloud specifically for embedded use.
In a usage-based model, you don’t pay for each viewer account; instead, you pay by consumption, measured in “analytical impressions” (basically dashboard views/interactions by external users).
Embedded analytics capabilities
Both Metabase and Tableau allow embedding of their charts and dashboards into other applications, but the ease, flexibility, and cost of doing so differ. It’s worth noting upfront that Metabase and Tableau are general BI tools first, not specialized embedded analytics tools. They can be made to work in an embedded context, but it’s not their primary design focus.
Metabase embedded analytics
Metabase provides built-in support for embedding its dashboards or individual charts into external applications. There are essentially two modes for embedding Metabase content: public embedding and secure embedding.
- Public embedding (iframe) – Metabase allows you to create a public share link for any dashboard or chart. This generates a URL that can be embedded in an <iframe> on any web page. It’s very easy to set up: copy the embed link and paste it into your application’s HTML. However, “public” means no access control – anyone with that URL can view the dashboard.
- Secure embedding with tokens (iframe with signed embedding) – For customer-facing scenarios where each user should only see their data, Metabase offers a secure embedding mechanism. This uses a signed JWT token to control access to the embedded dashboard. In practice, you would configure Metabase with an embedding secret key, then your application backend generates a signed token for each user that encodes what they are allowed to see (which dashboard, and optionally filters for that user). Metabase verifies the token in the iframe and displays the appropriate data. Metabase also provides an embedding SDK (for example, a JavaScript or React component library) to help implement this.
From a developer’s perspective, Metabase embedding is relatively straightforward to implement. Enabling embedding involves a few steps in the Metabase admin settings (to allow embedding and set the secret key for tokens). After that, adding an embedded Metabase chart to your app is as easy as embedding an iframe or using their provided React component.
One thing to keep in mind is that when you embed Metabase, you are effectively loading the Metabase web app inside an iframe. That means the loading speed and experience depend on Metabase’s performance. Users might see a loading spinner while the iframe content loads. Metabase is not known for lightning-fast load times, especially if the database queries are heavy.
Also, the embedded content will carry Metabase’s UI elements (for example, the filter widgets, the chart styles, etc., as designed by Metabase). While you can customize your dashboards within Metabase to an extent, you cannot fully white-label the UI to look like your own application’s native components.
The result is that embedded Metabase dashboards may feel somewhat “external” to your app’s UX (an iframe window into another tool), as opposed to something completely seamless. This is a common critique when using a general BI tool for embedding.
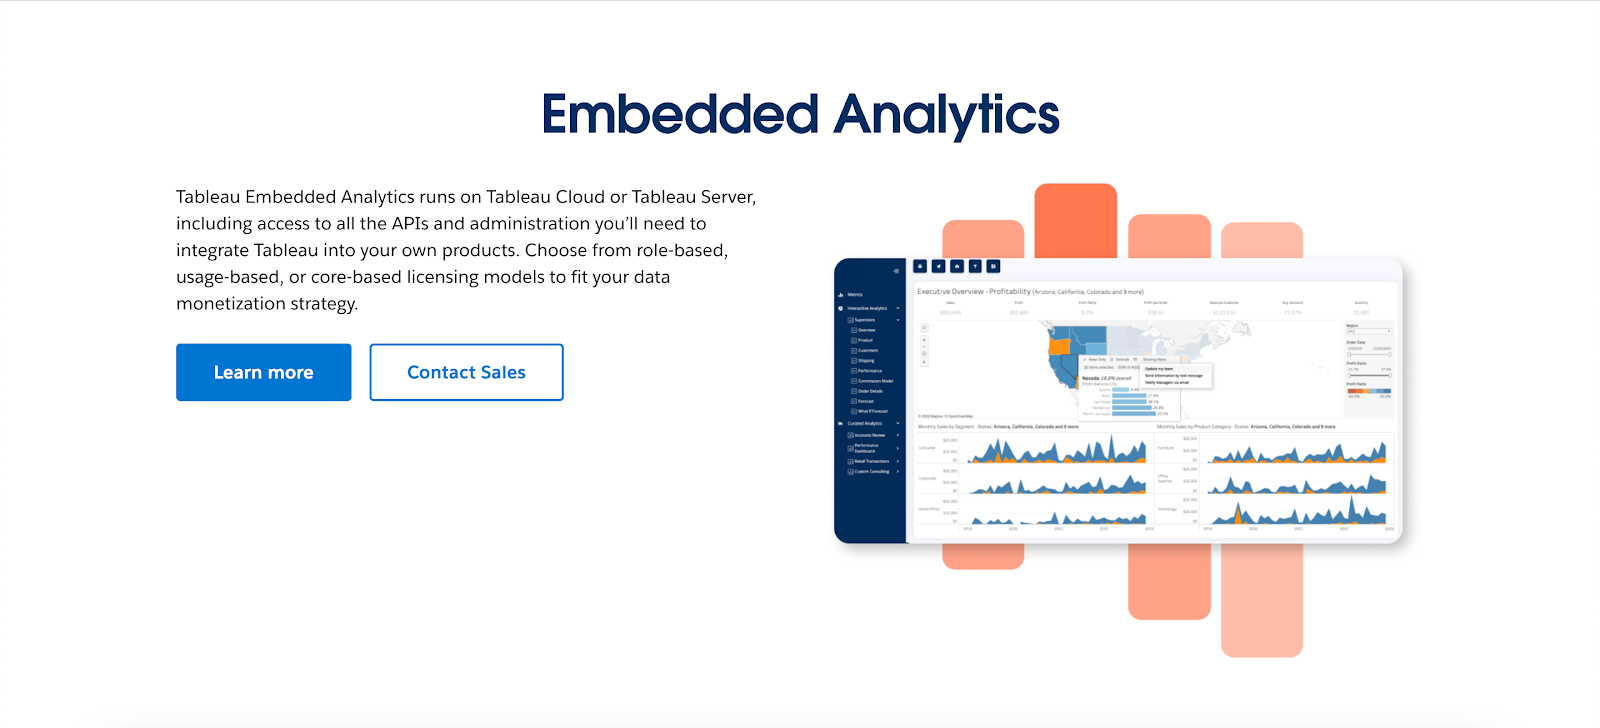
Tableau embedded analytics
Tableau’s approach to embedded analytics is powerful but comes with more complexity, reflecting its enterprise focus. There are a few common ways to embed Tableau content, depending on the audience and security requirements:
- Public embedding via Tableau Public – Easiest but very limited: you can publish a visualization to Tableau Public (which is a free service where anyone can see the viz) and then embed it in an iframe. Tableau Public provides embed code for each viz. This is only viable for non-sensitive data or public-facing visualizations (for example, a public report or infographic on a blog).
- Internal embedding (for internal users) – If you want to embed a Tableau dashboard on an internal page (say, inside your company’s intranet or a SharePoint site) for your team, and all the viewers are your employees with Tableau accounts, you can do this using Tableau Server or Tableau Cloud. Tableau provides a mechanism to embed views that requires the user to log in.
- External or customer-facing embedding – This is the scenario akin to embedding analytics into a multi-tenant SaaS product for your customers. Tableau has a product offering often referred to as Tableau Embedded Analytics for this. If using Tableau Server, many companies purchase a core-based license and use the trusted authentication method: your application authenticates the user and then generates a trusted Tableau session for them behind the scenes, so when they load the embedded iframe, they see the dashboard relevant to them. If using Tableau Cloud (SaaS), the newer approach is the usage-based embedded license as mentioned earlier, which lets external (unlicensed) users load Tableau embeds and charges by view counts. In either case, implementing this requires developer effort. You’ll use Tableau’s JavaScript API (the Tableau JS API) or the Embedding API to integrate. This API lets you do things like embed a viz object in a web page without a plain iframe tag (it still ends up rendering an iframe, but you can control it via JS). You can programmatically hide or show toolbar UI, pass filter values, respond to events (like a user clicking a mark), etc.
With great power comes complexity: setting up Tableau embedded analytics properly entails configuring authentication (either each user is a Tableau user or you set up a service account with filtering rules or the new anonymous embedding with impression tracking), and possibly deploying a Tableau Server infrastructure.
In terms of user experience, an embedded Tableau dashboard is very powerful for end users: they get virtually the same interactivity they would have on a Tableau site – all the filtering, tooltips, drilling, and so forth. You can even embed Tableau with or without the Tableau toolbar.
This can make for a somewhat seamless integration, but completely white-labeling is limited – the charts will look like Tableau charts (which are generally attractive, but styled in Tableau’s way). You can apply custom color palettes and some CSS tweaks, but you’re still essentially showing a Tableau interface embedded within your application. Users might notice differences in font or UI elements that indicate it’s an embedded third-party tool.
Performance is another consideration: When embedded, Tableau still has to load its engine to render the visualization. Tableau Server is optimized for advanced analytics, but if an embedded dashboard is complex (lots of data, many charts), it might take a few seconds to load.
Which one should you choose?
Not sure which BI and data visualization tool makes more sense for you? Here's a quick breakdown.
Choose Metabase if...
Metabase is an excellent choice if you’re a startup, small to mid-size business, or a team that needs quick deployment, simplicity, and affordability. Opt for Metabase if:
- Budget is a major concern and you want a low-cost (or no-cost) solution. Metabase’s open-source version has no per-user fees, which is ideal if you plan to embed analytics for many users without incurring licensing costs (but with a Metabase logo). Most other BI tools don't have a free version.
- Your team values ease of use and fast onboarding. Metabase’s intuitive interface allows even non-technical users to create and view basic dashboards. If you don’t have dedicated data analysts or BI developers, you’ll appreciate that product managers, support engineers, or any team member can do self service analytics to enable data driven decision making.
- You prefer self-hosting or need full control over your data environment. With Metabase you can deploy on your own infrastructure (on-premises or in your cloud) and keep all your data queries internal. This avoids vendor lock-in and is great for compliance since you control where the data lives and how it’s secured.
- Your use cases are centered on standard BI reporting (like KPI dashboards, simple reports, periodic data checks) rather than cutting-edge analytics. Metabase excels at straightforward SQL-based analysis and visualizations.
- Rapid development and iteration matter. If you want to get an analytics feature up and running in your product or internal tool ASAP, Metabase is generally faster to implement. You could have a prototype dashboard embedded in a day. It’s a good choice for lean teams who want results fast without a lot of upfront design of data models or spending weeks learning a tool.
Choose Tableau if...
Tableau is the ideal solution for organizations that have ambitious analytics needs, a larger scale, or an existing investment in BI expertise and infrastructure. Go with Tableau if:
- You need robust, enterprise grade capabilities. Tableau offers advanced features that Metabase doesn’t – from sophisticated data visualizations (advanced chart types, geospatial analytics) to complex calculations and even AI-driven insights on top of your preferred data stack.
- Your organization already has a data culture built around Tableau or similar tools. Perhaps you have team members experienced with Tableau, or you’re already using it in-house for other reporting. In such cases, extending Tableau makes sense to leverage that expertise.
- You need to integrate data from many sources and handle complex datasets. Tableau is very capable at connecting to a wide variety of data sources (databases, cloud services, spreadsheets, big data platforms) and handling large volumes via extracts or live connections.
- Having a polished, interactive user experience for end-users is critical. Tableau’s end result (the dashboards) are highly interactive and visually polished with enterprise level features. If you’re embedding analytics into a customer-facing app and you want that “wow” factor with interactive charts, beautiful visuals, and smooth drill-downs, whilst it won’t look like your application, Tableau does provide that out of the box.
- You have the resources (time, money, people) to support a more complex tool. This is an important point: Tableau will likely require training for your team, dedicated development of dashboards, and budget for licenses. If you have a BI team or at least someone who can become the Tableau guru, and you’re willing to invest in that, then Tableau can unlock a lot of value.
The better alternative to Metabase AND Tableau for embedding
Using an internal BI tool to embed analytics into your product for your customers comes with some trade-offs. These tools were built for internal BI, which doesn’t have the same requirements around loading speeds or customisation of the UI. The pricing models can also be prohibitive.
Unlike Metabase or Tableau, Embeddable was built specifically for product and engineering teams to deliver embedded analytics projects.. This means several things:
- Feels like part of your application - you have complete control over the UX and UI, in code, and it renders as a native part of your application (no clunky iframes!)
- Infinite extensibility - use the SDK to modify or extend the code of any chart, or import charts from any React charting library.
- Lightning-fast loading - supported by a performant data service and 2 levels of configurable cache.
- Intuitive developer experience - embed with a secure and lightweight web component and apply logical row-level-security.
- Pricing designed for embedding - via a fixed-cost monthly subscription that gives you certainty on what you’ll pay, no matter how much your user base grows.
- Intuitive self service analytics - with built-in features that give your end users the power to customize their own views of your dashboards.
Ready to find out why Embeddable could be a better choice than Tableau and Metabase for your embedded analytics project? Get access to Embeddable today.
Frequently asked questions
1. How do Metabase and Tableau differ for embedded use cases?
Metabase is open-source and easier to embed, while Tableau provides powerful visuals but is harder to integrate and license. Tableau often requires more setup and ongoing maintenance.
2. Which tool is better for customization inside a SaaS product?
Neither tool offers full flexibility and you'll notice some hallmarks of their UI remain when embedded into your own platfrom. Metabase enables you to embed single charts, which can help, whereas Tableau is more rigid and better suited for internal enterprise dashboards. If you need a tool that is fully customizable and offers true white labeling, Embeddable is better than Tableau or Metabase.
3. Does Tableau support multi-tenant embedding?
It does, but not out of the box. You’ll need to configure user filtering, licensing, and security controls manually.