What is Metabase and Who is it for? Detailed Guide
What is Metabase, what kind of users is it for and what makes it stand out against other BI tools?
Summarize with:
Data can be incredibly powerful, be it in the hands of your own team or the customers that use your product. With data insights, you can make smarter decisions, increase revenue, improve product adoption, tap into new markets and much more. One of the platforms that promises to get you there is Metabase, with its open source data visualization platform.
In a competitive market where businesses may be tempted to choose more mature software with an established market presence, Metabase seems like an underdog. However, the user friendly interface, a solid variety of data sources, and transparent pricing make it an interesting choice.
So what is Metabase, and how does it work?
What is Metabase?
Metabase is an open source data visualization and business intelligence tool that allows companies to visualize, analyze and explore data on their own terms. Unlike most other BI tools, it has an open source version that’s free to use if you host it on your own servers, which means that anyone can visualize and analyze data without paying for a license.
It has a no-code query builder which allows people without extensive coding knowledge to create basic data visualization. However, an SQL editor is available for more advanced users.
Besides the open source free plan, Metabase pricing is very transparent (for internal and embedded uses), which makes it an interesting alternative for businesses looking into enterprise-grade tools like Looker.
How does Metabase work?
Not sure if you can trust Metabase with all your data? Here's a step-by-step breakdown of how this powerful tool works.
1. Deployment: self-hosted or cloud
Metabase offers two deployment options based on your budget, security features, and more:
- Self-hosting: Businesses can deploy Metabase on their own infrastructure using Docker, Kubernetes, AWS, GCP, or any server that supports Java applications. This is ideal for companies that require full control over their data and have concern over the data security in their BI platform.
- Metabase Cloud: A managed hosting option where Metabase takes care of infrastructure, scaling, and updates.
For embedded analytics, most teams opt for self-hosting to control performance and data access.
2. Connecting databases
Once deployed, Metabase connects directly to various relational databases and data warehouses, including:
- PostgreSQL
- MySQL
- MongoDB (via BI connectors)
- Snowflake
- Google BigQuery
- Redshift
- ClickHouse
- And more
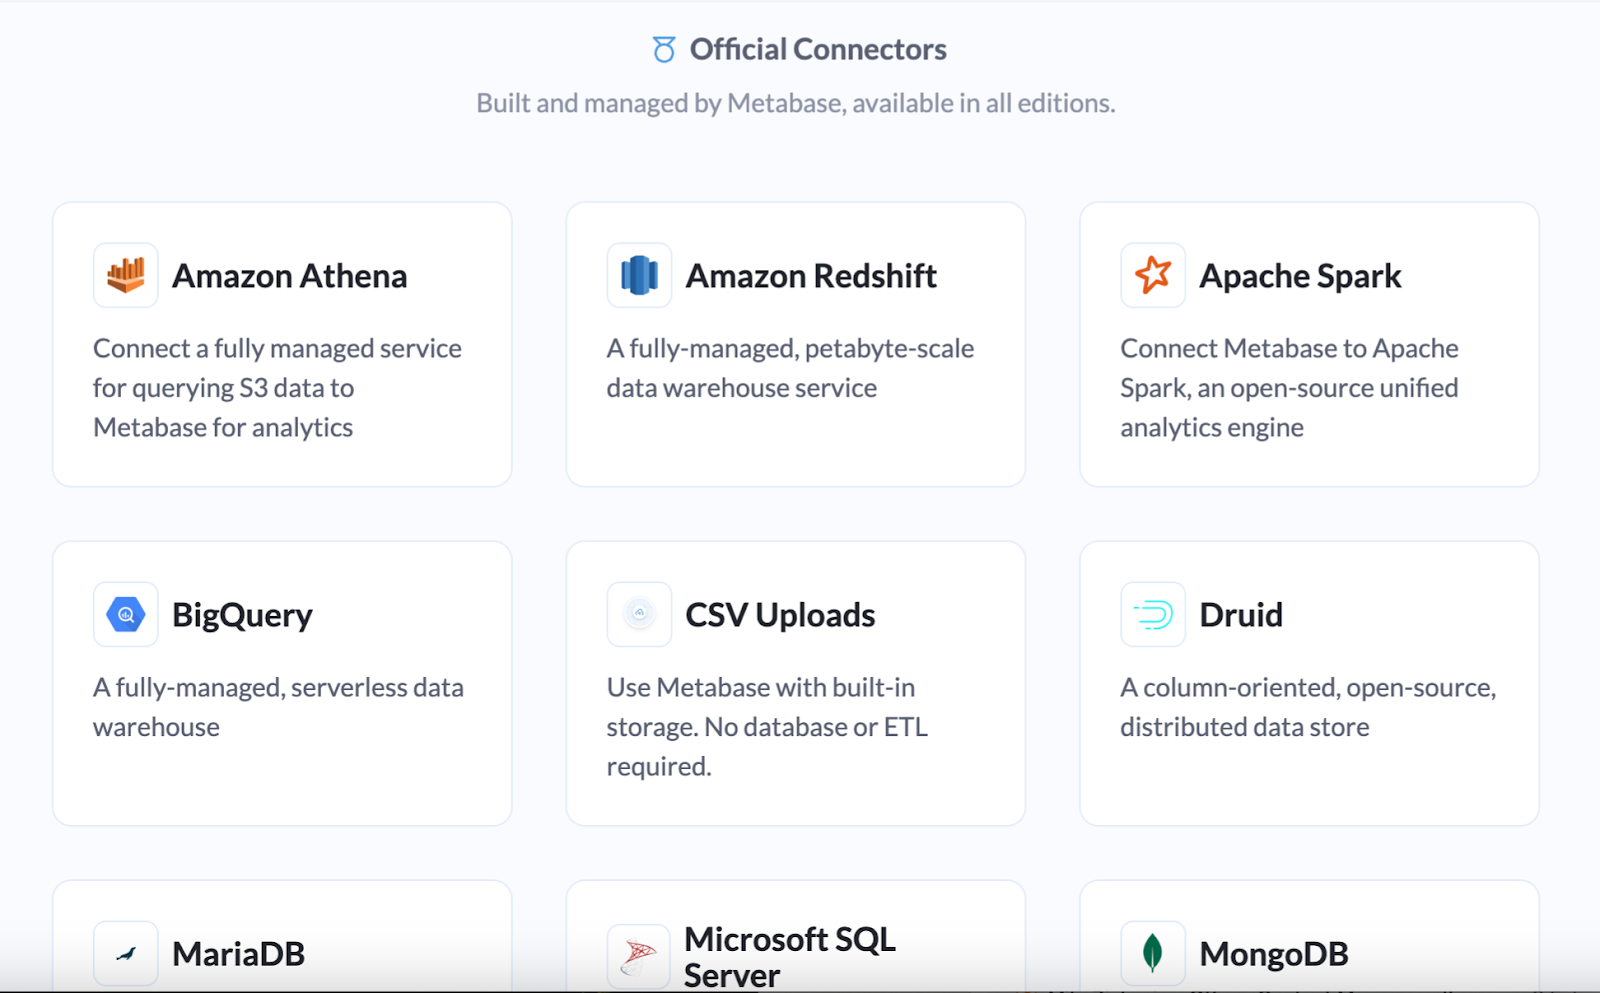
The connection process involves entering database credentials, selecting schema access permissions, and configuring caching for performance.
3. Data exploration (No-code + SQL editor)
Metabase provides two main ways to query data, one with a more intuitive interface for the everyday person and another with more advanced features.
- No-code query builder: Non-technical users can filter, group, and visualize data without writing SQL. This is useful for product managers and business teams who need quick insights and don't want to spend hours on preparation before data exploration.
- SQL editor: Developers and data analysts can write custom SQL queries with support for variables, joins, and CTEs. Saved queries can be reused across dashboards. This is the ideal setup for more advanced users that want to explore data in-depth.
Metabase also supports nested queries, where users can build reports based on previously saved queries, allowing for advanced data analysis without manual SQL work.
4. The Metabase SDK
This is the latest addition to the Metabase toolkit, helping developers embed individual Metabase components with React (like standalone charts, dashboards, the query builder, and more).
Instead of the old iframe method, Metabase now supports React, allowing you to embed individual elements and control their interactivity, theming and behavior directly from the Metabase app.
Similarly, platforms looking to enhance content creation can leverage the VistaCreate API, which enables integration of dynamic visual editing features directly into apps and workflows.
Speaking of which, customization is available but it still built on top of Metabase. This means you get granular component configuration with core Metabase features, such as internal permissions and data modeling.
4. Creating dashboards and reports
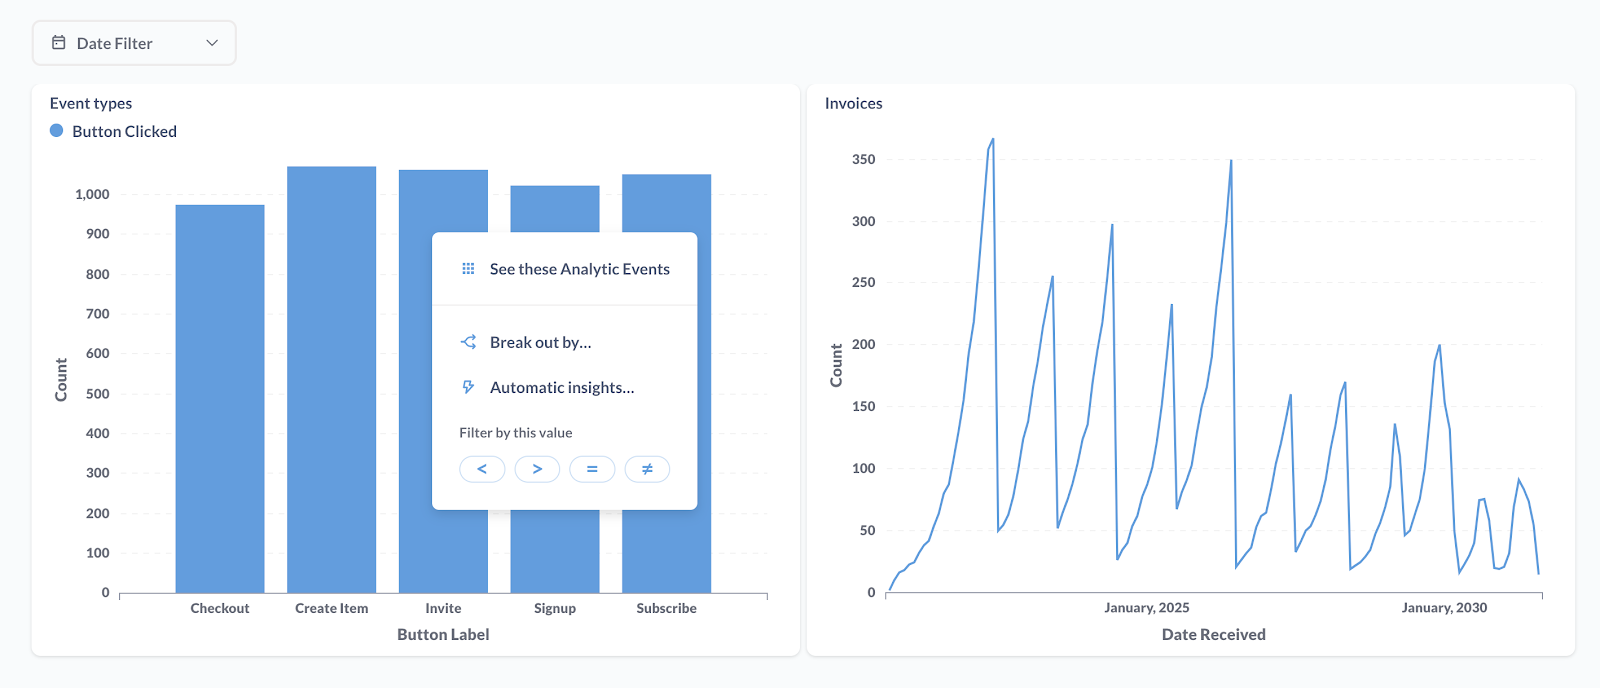
Metabase makes it easy to create interactive dashboards with various visualizations:
- Line, bar, and pie charts
- Tables with filtering and sorting
- Heatmaps
- Funnels and gauges
- Custom text and images for context

Users can drill down into data, apply dynamic filters, and share dashboards via public links or role-based access.
For embedded analytics, Metabase allows companies to integrate dashboards into their own apps, with full control over styling and access. You can exploit the auto refresh feature to always have fresh data loaded in your customers' dashboards.
5. Automating reporting & alerts
To keep teams and end-users informed, Metabase offers:
- Scheduled reports: Send reports via Slack, email, or other tools through webhooks on a recurring basis.
- Custom alerts: Trigger notifications when specific conditions are met (e.g., "Send an alert when daily active users drop below 5,000").
These automation features are useful for tracking business metrics without manual intervention.
6. Embedding Metabase into applications
For companies that need embedded analytics tools, Metabase offers:
- Public embedding: Simple iframe-based embedding for non-sensitive data.
- Signed embedding: A secure method where dashboards and charts are embedded in a web app, with access controlled via API tokens.
Developers can customize embedded Metabase instances to match their app’s colors and permissions, making it feel a little more like your own app for end users. For a truly native-feeling experience, you’ll want to explore a custom build or a headless embedded analytics tool.
7. Managing users & permissions
Metabase supports granular user permissions into various Metabase groups:
- Groups & roles: Assign users to teams with different database and dashboard access levels.
- Row-level security: Restrict data access based on user attributes (e.g., "Sales reps can only see their own deals").
- Audit logs: Track user activity for security and compliance.
This makes Metabase suitable for multi-tenant applications where different users need different data views.
8. Performance optimization & scalability
For teams handling large datasets, Metabase provides:
- Caching: Speeds up dashboards by storing query results in memory.
- Database connection pooling: Optimizes database performance under heavy load.
- Precomputed models: Developers can use materialized views or ETL pipelines to improve query speed.
Companies with high data volume often deploy Metabase alongside tools like dbt for data transformation and optimization.
As we'll explain in a minute, performance optimization is one of the areas where Metabase doesn't particularly shine.
Key Metabase features
Metabase offers a solid number of features for businesses in various industries, making it a good choice for data analysis and visualization. Here's why users opt for this open source BI tool.
Analytics dashboards: Metabase's analytics dashboards allow users to compile charts and questions into live dashboards equipped with interactive tools, facilitating intuitive data discovery and sharing.
Query builder: The query builder in Metabase enables users to create queries without the need for SQL knowledge, allowing them to filter, summarize, and visualize data through an intuitive interface.
Models: Models in Metabase are curated datasets derived from existing tables or queries. They serve as foundational elements for new questions, enabling teams to define business concepts and metrics consistently across the organization.
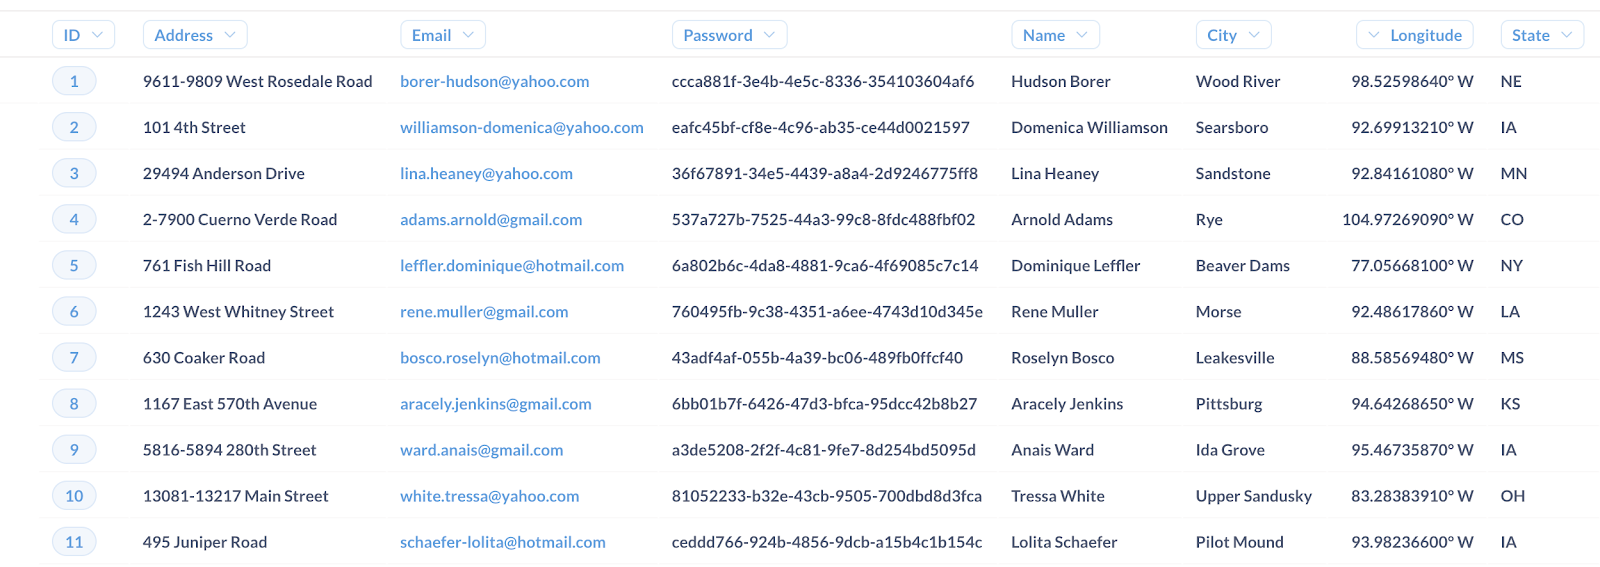
CSV upload: Users can analyze data stored in CSV files directly within the platform. This is useful for teams without an existing database, enabling them to perform in-depth analytics without requiring SQL or data expertise.
Usage analytics: Usage analytics in Metabase provide insights into how data and dashboards are utilized within the organization, helping teams understand engagement and identify areas for improvement.
Data drill-through: The drill-through feature in Metabase data visualization allows users to explore data in greater depth by clicking on specific data points within charts or dashboards, facilitating deeper insights and understanding.
SQL editor: Metabase includes a SQL editor for users who prefer writing native queries, offering flexibility for advanced data analysis and customization beyond the capabilities of the query builder.
Permissions: Metabase provides fine-grained control over data access, allowing administrators to set permissions at the database, table, or column level. This ensures that users only access data relevant to their roles, enhancing security and compliance.
Sandboxing: Sandboxing in Metabase lets you restrict data access at the row level based on user attributes, allowing organizations to personalize data views and enforce data security policies effectively.
Collections: Collections in Metabase are organizational tools that allow teams to group related questions, dashboards, and models. This structure helps maintain an organized analytics environment, making it easier for users to find and collaborate on data assets.
Who is Metabase for?
Thanks to its user-friendly interface, a variety of data sources and no need for SQL (in theory), anyone can use Metabase. However, the business intelligence arena has a large number of competitors, and only a certain portion of users flock to Metabase as their tool of choice.
Here are some of the most common user groups that use this open source business intelligence platform.
- Startups and small businesses
Startups and small teams love Metabase's open-source version, which allows them to get powerful analytics without paying for expensive business intelligence tools such as Looker, Tableau or Power BI. The no-code querying system makes it accessible to non-technical users who need to gain insights quickly. - Tech and SaaS businesses
Software companies use Metabase to analyze product usage, monitor KPIs, and generate reports without relying heavily on data engineers. Its self-hosting options also appeal to businesses that need control over their data. Specifically, SaaS companies use this open source business intelligence tool for embedded analytics, passing down the Metabase dashboards to the end users. - E-commerce businesses
Online retailers and marketplaces often use Metabase to track sales, customer behavior, and inventory trends. The tool’s ability to connect to various databases helps e-commerce teams consolidate insights from multiple sources. - Financial and fintech companies
Companies in finance and fintech leverage Metabase to analyze transaction data, detect patterns, and create automated dashboards for compliance and reporting. The security features and self-hosted option make Metabase suitable for handling sensitive financial data. - Marketing and analytics teams
Marketing teams use Metabase to track campaign performance, website metrics, and customer acquisition data. Its user-friendly dashboards and interactive features allow teams to share insights without requiring advanced SQL skills. - Healthcare and research organizations
Healthcare companies and research teams use Metabase for data exploration, patient analytics, and operational tracking. The self-hosting option is valuable for organizations that need to comply with data privacy regulations. The ability to manage permissions comes in handy for this use case too. - Nonprofits and educational institutions
Nonprofits and universities use Metabase to analyze fundraising, operational efficiency, and student performance data. The free open-source version makes it a cost-effective choice for organizations with limited budgets that don't necessarily have data teams ready to prepare data and create visualizations.
Some considerations when choosing Metabase as your business intelligence tool
While Metabase data visualization gets a lot of praise, there are certain downsides that you should be aware of before opting for the open source version or a paid plan.
The dashboard loading speed is not that phenomenal
Primarily, the interactive dashboards can be very slow to load if you have too many visualizations running in the same dashboard. As one user put it:
"The dashboards sometimes have a slower load time in cases of too many graphs or charts on the file."
And as another user said, the additional features take a toll on the performance, compared to the older versions of Metabase:
"The newer version is more feature-rich but resource-hungry, affecting the performance a bit when hosted in our ECS cluster. While it has excellent UI and visualization tools it is still more suited for an advanced user."
While the loading times of your dashboards may not be such a huge concern for internal use cases, it can be a major hurdle if you want to embed dashboards in your product. For customers that prioritize fast data driven decision making, every second counts.
And it's not just a matter of the number of dashboards. If you run lots of queries from multiple data sources, the load times can get pretty bad.
"Sometimes Metabase can take a lot of time to run queries." - Source
The editor/visual query builder can be challenging to work with
Users complain that when they are making adjustments to their dashboards and reports, they don't show up on the live report immediately. Instead, the user has to go back and forth to make the changes and see what they look like when done. It may be just a few clicks, but if you create a lot of reports, this can take a while.
"When building queries you have to go back to the editor to keep making changes, it would be great to have the editor and the report live side by side so that when you make changes you can see them in realtime. Would make it easier to make smaller adjustments, sometimes it can be quite lengthy to make one minor change because you have to keep going back and forward." - Source
The better alternative to Metabase for embedded analytics
If you're considering an embedded analytics tool to help your end-users with data exploration, there are plenty of alternatives to Metabase data visualization. If you value high flexibility, a wide variety of chart types, lightning-fast loading speeds, and easy embedding, look no further than Embeddable.
Our customers love Embeddable because it's a developer's dream come true: you can define your own reusable charting components in React.js, or build on top of our open source component library. Then push the components to Embeddable using our SDK. Your non-technical team can then use these to craft and iterate on the end-user experience with drag-and-drop simplicity.
Finally, embed your dashboards as HTML web components with no iframes.
Oh yeah, and our customers' customers love the fast, beautiful dashboards too.