Sisense vs Power BI: An In-Depth Comparison
We compare Sisense and Power BI for data modeling, embedding, visualization capabilities, pricing and other details to help you find the best BI tool for your needs.
Summarize with:
Business intelligence tools like Sisense and Microsoft Power BI are popular choices for companies that want to analyze data, visualize dashboards, and share insights. But if your use case involves embedded analytics (putting data visualizations directly into your product or customer-facing platform), the differences between the two start to matter a lot more.
Power BI gets a lot of praise for its ease of use and integration within the Microsoft ecosystem. On the other hand, Sisense is positioned more toward embedded use, with features like APIs, SDKs, and a developer-focused toolkit. However, neither platform was originally designed for embedded analytics, and this core limitation remains evident.
In this guide, we compare Sisense vs Power BI across every major area:
- Target audience
- Embedding options
- Data modeling
- Customization
- Performance
- Pricing, and more.
Let's help you find the best business intelligence tool for your use case.
Who these tools are built for
Power BI is built for internal business users, especially companies already using Microsoft tools like Excel, Azure, or Dynamics.
It’s often the default choice for finance, sales, and operations teams for internal dashboards, department reporting, or executive overviews. It supports both self-serve and analyst-created reporting, and it’s approachable for non-technical users with basic Excel skills. Compared to Sisense, Power BI has a lot more presence in global teams.
Sisense, by contrast, has made a deliberate move toward external use cases over the past few years. While it started as a BI tool for internal use, the acquisition of Periscope Data helped push Sisense into embedded analytics.
It now markets itself to product and engineering teams who want to add analytics to customer-facing platforms. However, many customers still use it for internal dashboards, and it requires more technical investment upfront to help you go from raw data to real insights.
Summary: Power BI is geared toward internal business intelligence. Sisense is better aligned with embedded analytics use cases but carries more technical complexity.
Power BI vs Sisense: embedding capabilities
Here’s where things get more clear-cut. Embedding dashboards, charts, and reports is technically possible with both tools, but neither offers an embedded experience that feels native without serious developer work.
Power BI Embedded is a separate Azure product. It lets you embed dashboards into external web apps using iframe or JavaScript SDK methods. However, reports still carry the Power BI look and feel, including branding, layout, and interaction controls. White labeling is limited. Authentication for embedded content requires Azure AD, and managing user access typically means setting up custom token exchange flows.
Sisense provides more embedding options. You can embed entire dashboards, individual widgets, or even just data endpoints using their JavaScript SDK or APIs. With the Compose SDK, you can skip the prebuilt UI entirely and pull raw query results into a custom-built front-end. This is especially useful for SaaS apps where embedding needs to feel native.
However, even Sisense relies heavily on iframe-based approaches by default, and its dashboard customization layer (BloX) still operates within its ecosystem. Truly native embedding still requires substantial dev work.
Verdict: Sisense is more flexible and developer-friendly than Power BI for embedded use, but neither is designed explicitly for this purpose. If you need native-feeling dashboards, both fall short without a serious engineering effort.
You may want to explore a tool built specifically for embedded analytics to achieve a modern, native, and performant end-user experience.
Data modeling approach
Power BI uses a tabular data model backed by the VertiPaq in-memory engine. Data can be imported (for better performance) or queried live (via DirectQuery).
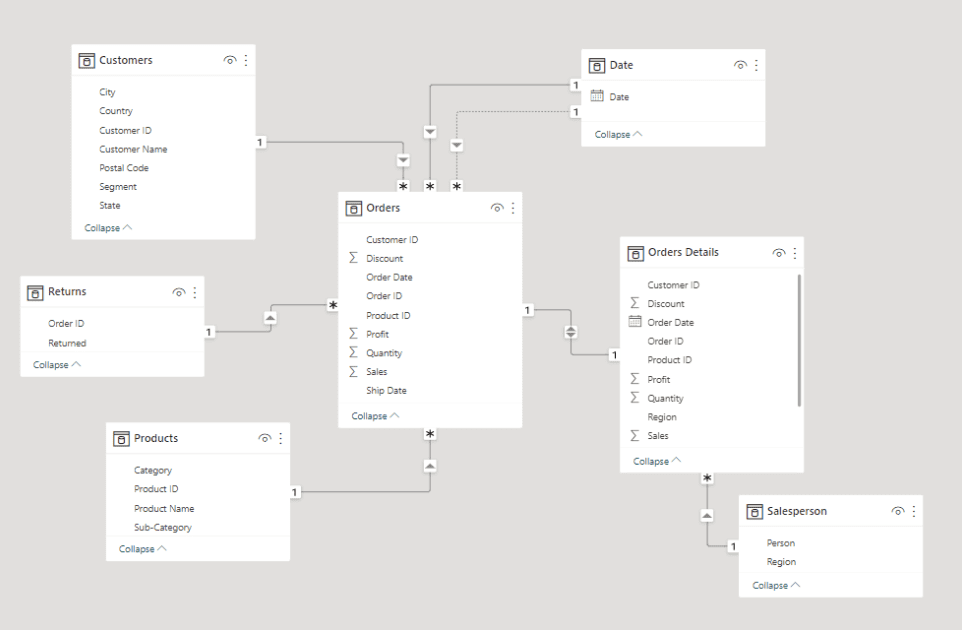
The tool uses Power Query for transformations and supports calculated columns and measures through DAX. It’s powerful, but DAX has a steep learning curve for users unfamiliar with formula-based logic.
Sisense supports both in-memory ElastiCubes and live connections to cloud databases. ElastiCubes must be refreshed manually or on a schedule, but many users bypass them for real-time data access.
Sisense also supports live connections to external databases and cloud data warehouses, which makes it flexible for hybrid data environments. You can write custom SQL or use visual tools to define joins and transformations.
Summary: Power BI is easier for analysts and Excel users. Sisense is more flexible for complex or custom data pipelines, but requires technical skill to operate efficiently.
Dashboard customization
Power BI offers dozens of built-in visual types and supports custom visuals through its developer platform. It allows some styling and branding changes, and you can use R or Python scripts to extend its visualization options.
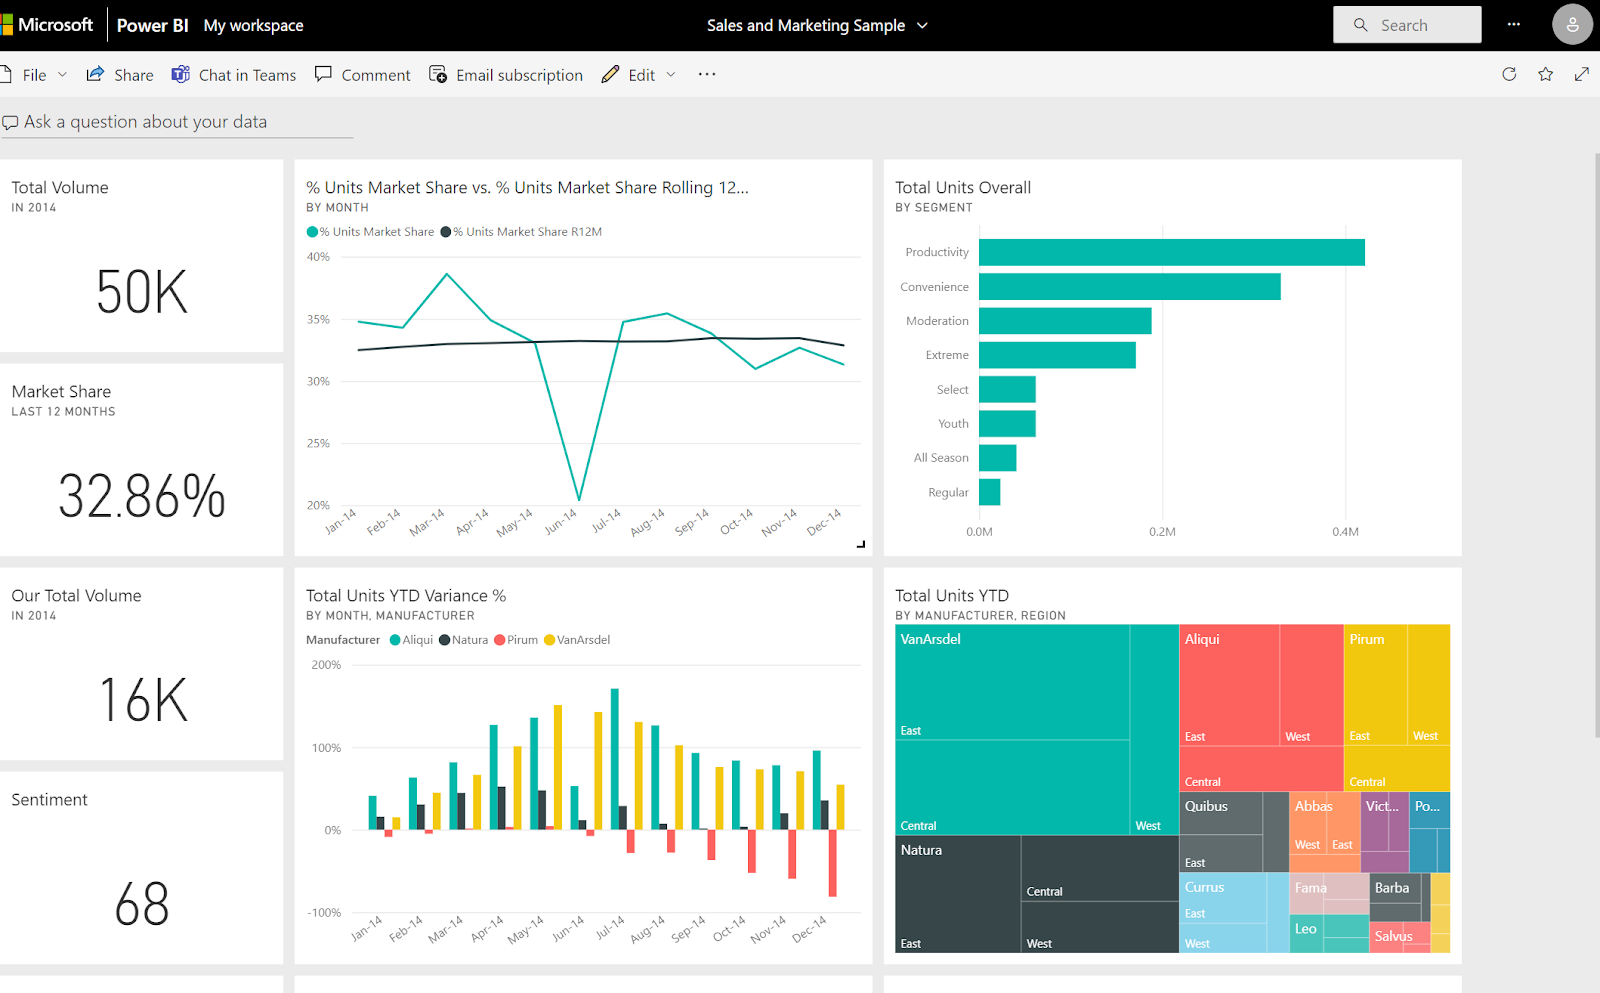
However, embedded dashboards look and behave like Power BI dashboards. You don’t get full control over layout, navigation, or interaction behavior. You can visualize data with a wide range of charting options, but you can't make the dashboards look native in the app.
Sisense provides more control, particularly for developers. With BloX, you can build widgets using HTML, CSS, and JavaScript. You can override many UI elements using BloX or Compose SDK, but this requires front-end development skills and access to higher-tier licensing.
Bottom line: Sisense offers better customization for embedded dashboards. Power BI is simpler to use, but is limited to the Power BI experience.
Ease of use
Power BI is widely considered one of the most user-friendly BI platforms, especially for simple implementations and for non-technical users. Its interface resembles Excel and supports drag-and-drop report building, slicers, filters, and other familiar UI elements. New users can build basic dashboards quickly without writing code.
Sisense is less intuitive. The core dashboarding tools are straightforward, but most of the platform’s flexibility, such as embedding, BloX customization, API usage, and Compose SDK, requires developer involvement. For many companies, Sisense ends up with joint ownership by the data and engineering teams.
Conclusion: Power BI scores better for ease of use. Sisense offers more power, but with a steeper learning curve.
Integration with other tools
Power BI connects seamlessly to other Microsoft products, including Excel, Teams, Azure, Dynamics, and SharePoint, and supports dozens of prebuilt connectors to third-party platforms.
It’s easy to pull in from data sources like Salesforce, Google Analytics, SQL Server, and more. For Microsoft-centric companies and their business analytics needs, these integrations save time and effort.
Sisense supports live and in-memory data from multiple sources like Snowflake, BigQuery, Redshift, and more. It also supports REST APIs and plugin development, which gives you a lot of flexibility. It lacks the polished plug-and-play connectors Power BI offers for the Azure suite, but it’s more adaptable to custom data pipelines.
Summary: Power BI is easier if you’re already using Microsoft tools. Sisense is more open-ended for cloud-native teams with complex data workflows.
Performance and scalability
Power BI performs well for small to medium datasets, especially in import mode. For larger or more dynamic datasets, Power BI Premium is required to unlock larger model sizes and dedicated capacity. That makes performance heavily dependent on licensing tier and deployment setup, whether you use Power BI desktop or the cloud version.
Sisense performs well at scale when configured well. ElastiCubes allow in-memory querying, and caching helps performance for embedded views - but comes with additional costs. The add-on for distributed servers improves perceived speed by allowing you to query only what you need instead of rendering full dashboards.
Conclusion: Sisense is built with more scalability in mind for external audiences, but only if your team has the resources to configure and maintain it.
Collaboration and sharing
Power BI is designed for internal collaboration and data analysis. Users can share dashboards across workspaces, embed reports in Teams or SharePoint, and use row-level security for data segmentation. Comments and tagging features are included, and version control is handled inside the service.
Sisense supports sharing via public links, scheduled emails, and embedded access tokens. It’s focused more on delivering dashboards externally, via apps, portals, or customer-facing platforms. Co-editing is limited, and there’s no native integration with team tools like Slack or Teams.
Summary: Power BI is better for internal sharing and data management. Sisense is more suited to external dashboard delivery, helping end-users make more informed decisions.
Pricing and licensing
Power BI Pro costs $10/user/month and includes access to all self-service reporting features. Power BI Premium, required for larger datasets or enterprise deployments, starts at $4,995 per month per capacity.
Power BI Embedded follows a consumption-based pricing model in Azure, with prices based on rendering time and compute units (A1–A6 tiers). It starts around $735/month (based on hourly compute usage in Azure) but can scale quickly.
Sisense does not publish pricing. According to our own research, small deployments typically cost between $10,000 and $20,000 per year. Larger deployments with embedding and Compose SDK access can reach $50,000 to $100,000+. Pricing varies based on user tiers, compute, and support.
Verdict: Power BI Embedded is more affordable for small teams, and can scale up for enterprise use cases. Sisense is priced for mid-sized or enterprise companies building external analytics products.
Security and governance
Power BI uses Azure Active Directory for identity and access control. It supports multi-factor authentication, row-level security, audit logs, and compliance with standards like ISO 27001, GDPR, and HIPAA. It’s a strong choice for companies with existing Azure infrastructure.
Sisense supports SAML, LDAP, and JWT-based authentication. It offers row-level filtering, multitenant support, and secure token-based access for embedded dashboards. You can deploy Sisense in your own VPC, which gives you more infrastructure control than Power BI’s cloud-only model.
Conclusion: Both tools meet enterprise security requirements - but both require maintenance of a user map within their platforms. Sisense offers more deployment options for teams that require isolation or on-premise control.
Mobile experience
Power BI has native mobile apps with responsive dashboards and offline access. It also supports custom mobile layouts, making it easy to design for small screens. You can create interactive reports that will look good across platforms.
Sisense also offers mobile apps, but they focus on viewing dashboards rather than interaction. Many teams building embedded analytics for mobile build their own frontend using the Compose SDK instead of relying on the default mobile experience.
Takeaway: Power BI wins for out-of-the-box mobile dashboarding. Sisense gives developers more flexibility when building from scratch.
Support and documentation
Power BI has a large global community, thousands of online tutorials, and detailed official docs. Enterprise support through Microsoft is available with Premium licensing. Though navigating all of the complexities of their documentation, and familiarising yourself with PowerBI’s many brand-named features might take a while to get your head around.
Sisense has solid documentation which can be easier to navigate than PowerBI.. However, the community is smaller, and support quality can vary depending on tier and contract.
Conclusion: When you compare Power BI and Sisense in this aspect, Power BI has a stronger ecosystem for self-service support. Sisense is more developer-focused, but it is well-documented for those use cases.
An alternative, built for embedded analytics: Embeddable
Both Sisense and Power BI offer embedded capabilities, but neither was built for embedded analytics from the start. They rely on retrofitted workflows, iframe containers, and rigid UI systems that make it hard to deliver fast, native-feeling dashboards inside a product (not to mention the feature bloat).
Embeddable is built specifically for in-app, customer-facing dashboards. It’s a developer-first toolkit that gives you building blocks to create truly remarkable user experiences. It’s a modern embedded analytics platform designed from day one for product teams and developers. You get:
- No iframes, no vendor-branded UI
- A front-end SDK to extend, import, and apply your design system to charts giving you unlimited control and all the chart types you need
- Lightweight data APIs that fetch just what you need
- Built-in multitenancy and row-level access control
- Transparent pricing with no seat/usage-based licenses
- Sub-second performance, even for large datasets
Embeddable doesn’t sit next to your product. Instead, it lives inside it. Developers can build fully custom dashboards that feel native, load instantly, and adapt to your users' needs.
If you're delivering embedded analytics to customers and not just internal team members, Embeddable might well be a better option.
Conclusion
To make it easier for you to choose the right BI tool, here's a very simple breakdown:
- Choose Power BI for internal dashboards, especially if you already use Microsoft tools and want a fast, affordable way to analyze data.
- Choose Sisense if you're looking for one tool for internal BI in addition to embedding analytics in a SaaS platform, and you have developers ready to support it.
But if you're building embedded analytics that feel native, flexible, and scalable, you might be better served by a tool that was built from the ground up for that specific, specialist job.. Embeddable is built for this exact use case, without the baggage of legacy BI tools.
FAQs
What’s the main difference between Sisense and Power BI?
Sisense is more flexible for embedding dashboards into customer-facing products, while Power BI is better suited for internal business reporting. Power BI is easier for business users, but Sisense offers more developer control for custom embedded use cases.
Is Power BI good for embedded analytics?
Power BI offers embedding features, but they rely on iframes and have limited customization. Branding, layout, and user management are restricted unless you invest in complex setups using Azure services. It’s more of a workaround than a native embedded solution.
What makes Embeddable better for embedded analytics?
Embeddable is built specifically for embedding analytics into software products. It avoids iframes, provides SDKs for full UI control, handles multitenancy and roles out of the box, and offers faster performance with simpler pricing. Unlike Sisense or Power BI, it’s not a general BI tool with embedded features added later. In other words, it’s designed for embedding from the start.