4 Best Metabase Alternatives for Embedded Analytics in 2026
Metabase is one of the most popular BI platforms with dual hosting options. It’s also more affordable than other mature tools in the market. However, Metabase falls short when it comes to embedded analytics. So, we put together a list of four different alternatives to help you make a decision. Take a look at the comparison inside.
Summarize with:
Metabase is a capable BI tool for internal analytics. But if you're building embedded, customer-facing analytics into a product, it has limitations—some of which you might already be aware of, if you’re reading this. Some of its most notable drawbacks:
- It embeds via iframe.
- It offers limited UI control.
- It wasn't built with native product experiences in mind.
This article covers the four best Metabase alternatives for teams that need more, compared on embed method, customization, pricing, and fit for embedded use cases. If you're evaluating Metabase for embedded analytics specifically, here's what you need to know.
Discover a developer-friendly toolkit that’s purpose built for creating remarkable customer-facing analytics in a fraction of the time. Learn more.
Metabase Embedded Analytics

Metabase is a business intelligence and data analytics platform that claims to remove the SQL barrier. Anyone on your team can log into the tool and find data-based answers to their questions—without writing any code. It also has two embedding options: Static Embedding (available on the free tier, with a "Powered by Metabase" badge) and Interactive Embedding (Pro and above), which gives your users access to querying and drilldowns.
Once set up, this software is intuitive and user friendly. However, while you can come up with simple dashboards fast, users say you need to write code to process more complex queries or come up with custom calculations.
Unfortunately, Metabase only supports embedding through an iframe. With this approach, you’re only sharing a presentation layer in your website or app, and you can’t edit it in code to fit your design system. As a result, Metabase's iframe-embedded analytics experiences can be slow and clunky to load—and always feel foreign to your app.
Why you might look for an alternative to Metabase for embedded analytics
You’re most likely looking for an alternative to Metabase if you:
-
Don’t want to embed using an iframe. iframes are easy to set up. However, these make the app feel clunky, are slower than loading native web components, and need to be reloaded to update to global app settings like dark mode and languages.
-
Need more visualizations and design freedom. One of the biggest downsides to Metabase is the very opinionated UX and UI. The dashboards always look like Metabase, not your app, and there are limited options for editing visualizations. "Customizing visuals is also somewhat limited — you don't get the same depth of control over chart formatting," says Gorav A., Catalog Management Executive and Metabase user.
-
Need multi-source data blending. Metabase connects to multiple databases, but can't join data across them in a single query. If your dashboards need to combine data from more than one source, you'll need a data warehouse to consolidate it first, adding infrastructure complexity before you've embedded a single chart.
-
Want a more performant tool. Users complain about Metabase taking too long to load real-time data, which is crucial in user-facing analytics, where customers expect to see data on-load. "Performance can sometimes slow down when working with very large datasets, complex SQL queries, or heavily filtered dashboards," says Bharat Singh B., Business Analyst and Metabase user.
-
Want a truly no-code tool. You don’t need to know how to write SQL queries if you’re planning to build very basic dashboards. But, if you need to create custom formulas or add specific filters, someone from the data team will have to jump in—potentially causing bottlenecks. Setup is often more complicated than it seems, as the plug-and-play connectors aren’t available for all data sources.
In short, Metabase is a good choice for businesses that want to embed static or interactive dashboards but don’t need to have control over the UX. You could also benefit from using Metabase for beta testing. It’s an affordable product, so you can use it to gauge which metrics your users find valuable—not necessarily as the final version of your analytics experience.
Metabase also lags behind on AI features and chart types compared to newer platforms—a limitation that becomes more apparent as product teams raise the bar on what customer-facing analytics should look like.
"It doesn't have an inbuilt engine, and Metabase UI hasn't been updated with new AI features or newer types of charts," comments Saurabh B., software engineer and Metabase user.
4 best Metabase alternatives at a glance
In our shortlist, we’ve got business intelligence tools with embedding functionality, purpose-built embedded analytics platforms, and our very own toolkit: Embeddable. Here’s a quick overview:
| Metabase | Embeddable | Preset | Sigma | |
|---|---|---|---|---|
| Embed method | iframe | Web component | iframe | iframe, React SDK, REST API |
| Main benefit | Full BI capabilities embeddable for your users | Full control over UX and UI in code, at a fixed price | Built on open-source Apache Superset so it's more customization than most BI tools | Spreadsheet-like interface makes complex queries accessible to non-technical users |
| Main disadvantages | Opinionated UI and UX when embedded; limited customization | Newer to the market; requires some developer input | Steep learning curve; non-technical users may struggle | Limited visualization customization; won't feel native when embedded |
| Pricing | Starter: $100/mo (5 users); Pro: $575/mo (10 users) | Fixed monthly rate—no per-user or per-viewer fees | $20/user/month + $500/mo for 50 embedded viewers (Professional plan) | Custom pricing; median contract ~$61,520/year (Vendr, 2026) |
Let’s review these platforms in more detail:
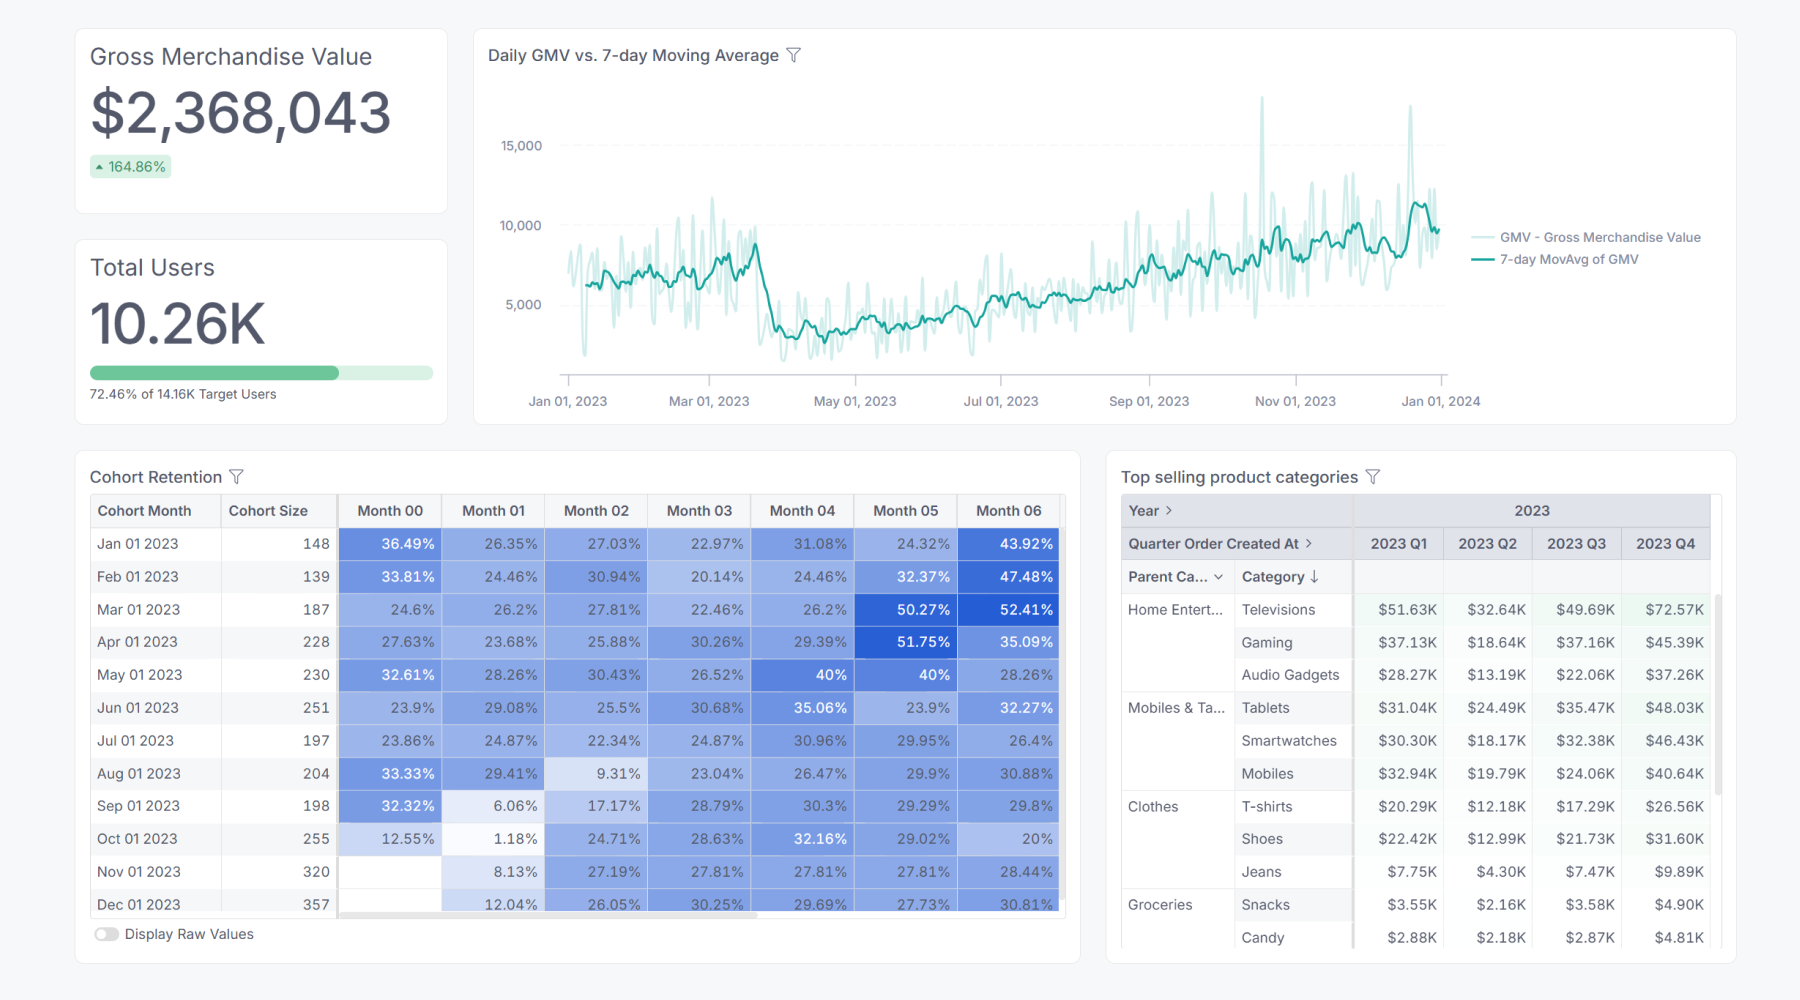
1. Embeddable
Embeddable is a dedicated platform for building fast, interactive user-facing dashboards that feel native to your existing platform.
It's used primarily by tech companies, from startups to scale-ups and enterprises.
Embeddable comes with:
-
A powerful no-code dashboard builder. Your customer-facing team can use the charts and data models you’ve defined to build and iterate upon your dashboards without writing a single line of code. Instead, they use an easy-to-use drag-and-drop report builder with point-and-click functionality to come up with experiences that meet user needs, and align with your brand.
-
Next-gen embedding. Unlike tools like Metabase, Embeddable loads your analytics directly in your DOM via a web component. This makes analytics load even faster because there’s no slow, clunky iframe to load before the data can be requested from the data source. It also allows for bi-directional communication between the charts and your app, enabling you to seamlessly integrate your analytics into your app experience.
-
Row-level security and performance, built-in: This handles row-level security, caching, performance, and interactions between components. Embeddable also integrates with most of the best databases for embedded analytics through a read-only transaction, so your data is secure and loads super fast. Plus, you can customize the cache for even better performance.
-
Powerful self-serve functionality for end-users: the Custom Canvas feature uniquely enables you to create “build-your-own-dashboard” experience for your customers using charts and components that match your design system to the pixel.
What users say about Embeddable
Users prefer Embeddable over other options because it helps them build remarkable user-facing analytics that look and feel native to the app. All in 10% of the time it would take them to build them from scratch.
“Embeddable is the first tool I’ve seen where it’s so straightforward and simple to work with the data and build charts, where it feels like the heavy lifting is done once I finish modeling my data. The ability to then use some simple JavaScript and React to build my own combination of charts (rather than navigating the jungle of combo charts in existing BI tools) is simply amazing.”— Adeola Morren, founder of iBenjamen Studio
“Easy to use, clearly-written docs, super friendly team.” - Bart Lammers, CTO at Eyk
"What really excited me about Embeddable was what comes after [embedding analytics]. We're talking about building filters, letting our users manage the charts themselves, and letting the team beyond just me make changes. That's where it starts to get really lucrative." — Nick Larson, Co-founder and CTO at AnyCreek.
Embeddable's headless architecture approach lets you bring data models together with fully bespoke charting components. Your engineers have full control over your visualizations in code, and your non-technical team has the full power of a modern, intuitive no-code builder in which to craft the end-user experience.
Embeddable pricing
Embeddable offers a fixed embedded analytics pricing model. This means you pay the same bill every month with no hidden costs or extra fees per user, viewer, or dashboard. A fixed rate makes Embeddable an attractive solution for businesses with a large or growing user base.
Embeddable vs Metabase Embedded Analytics
Embeddable is vastly different from Metabase, especially in these areas:
-
Metabase is a traditional BI tool with embedding capabilities using an iframe. However, Embeddable was purpose-built for customer-facing analytics and so embeds them using a more-performant web component method.
-
Metabase is a plug-and-play product that requires technical knowledge but is limited in terms of what can be customized. Embeddable is an SDK that gives your engineers the freedom to tweak the code while making it easy for non-technical users to create dashboards.
-
Metabase’s pricing tiers include a base fee plus a per-user rate that compounds as your team grows. Embeddable charges a fixed monthly rate with no per-user or per-viewer fees.
-
A limited, Metabase-branded version is available for free if you self-host it. Embeddable fully white label, always.
-
Embeddable feels fully-native in your application, whereas Metabase has a very opinionated UI and UX when embedded in your application.
Pro tip: Metabase is an affordable choice for internal and simple BI such as analyzing sales trends, social media performance, or headcount. However, if you want to share data with your users, allow them to interact with it, make custom calculations, and present dashboards that follow your brand guidelines, Metabase might not be for you. For fast-loading, fully bespoke, and secure user-facing analytics, Embeddable could be the better option.
2. Preset (built on Apache Superset)
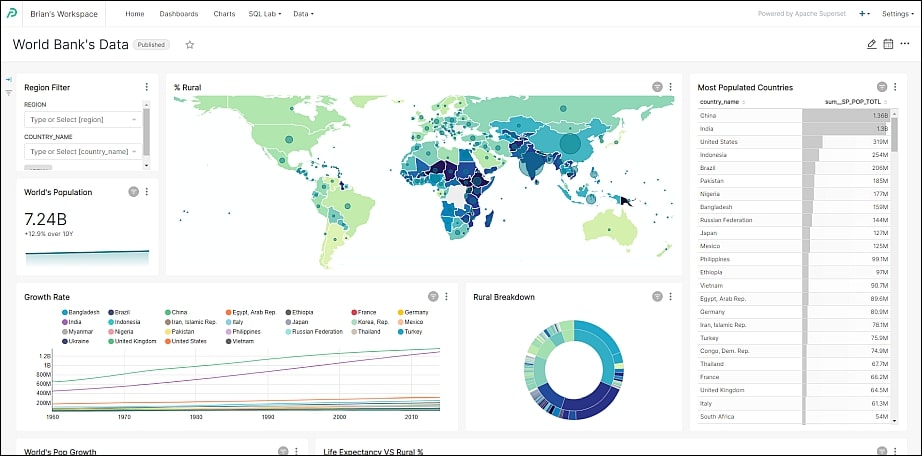
Preset is built on top of Apache Superset, a popular open-source BI platform. As Superset’s fully-managed version, Preset gives you some of the benefits of open-source with the support of a SaaS solution.
Preset allows you to:
- Embed dashboards with an iframe using the Preset API
- Access a big chart and visualization library with multiple data visuals
- Use filtering and data exploration capabilities
- Set permissions for user and role-based access
- Query and explore data using the SQL Lab
However, like all open-source tools, you need to have coding experience to fully customize Preset—and even still, some users report a lack of flexibility. Your developers will need to set some time apart to make the most out of this tool.
“It took a little learning curve to get colors customized but there are a few videos online,” says Reddit user on subreddit r/BusinessIntelligence. “There are lots of charts, but sometimes I wish I could customize little things in them, especially the fancy ones that need the data in a certain format to use.”
What users say about Preset
Users are drawn to Preset because of the ability to customize the charts and visualizations a bit further. However, the learning curve is steep and there are still limitations to how much you can edit the charts.
“I like Preset’s rich feature set and that it’s open-source in nature (Apache Superset). Unlike its competitors, it's quite challenging to use, especially at the start. Some features, you can't really expect non-technical users to be able to use intuitively.” — Data analytics manager and Preset user.
Preset pricing
Preset comes at three different prices:
- Starter. Up to five users, unlimited dashboards and charts, free forever.
- Professional. $20/user/month (billed annually, $25/month billed monthly) for unlimited users and 3 workspaces, plus embedded add-on for $500/month for 50 viewers.
- Enterprise. Custom quote including SSO, dbt integration, managed private cloud, and embedded add-on with volume discounts.
Preset vs. Metabase Embedded Analytics
Here’s how they compare:
- Metabase is itself open-source, with both self-hosted and cloud-hosted options. Preset is a managed cloud service built on top of open-source Apache Superset.
- Preset is more customizable than Metabase, especially in terms of design and visualizations.
- Metabase is easier to set up and use than Preset, although both can have a steep learning curve for handling complex queries.
- They both embed using an iframe.
- Preset offers more granular security settings compared to Metabase.
- Preset can be more cost-effective than Metabase for teams with a large number of embedded viewers, given its flat viewer license model.
Pro tip: If you want to build user-facing analytics experiences that feel similar to the rest of your app, Preset gives you more control over your dashboards. However, if you want an easy to setup and use app with basic reporting capabilities, then Metabase might be a better fit.
3. Holistics BI
Holistics is a more modern and developer-friendly BI and embedded analytics platform than Metabase, built for fast-growing SaaS companies. It stands out as a strong alternative to Metabase, and a more accessible one than solutions like Looker, for teams that want deeper modeling control and more flexible white-labeling options.
Key aspects of Holistics:
- Custom themes, styling, and CSS let product teams create dashboards that look more integrated into their app.
- Interactivity: users can drill down, view underlying data, filter, and explore insights intuitively.
- A governed semantic layer, including native dbt semantic layer integration, that allows developers to define metrics once and reuse them everywhere to deliver consistent, accurate numbers across all customer instances.
- Git-native workflows, CI/CD, and testing environments give teams full version control and safe, reviewable deployments.
- Variables let teams parameterize widgets and dashboards, making components easy to reuse across tenants and modules.
- Ask AI: embedded users can explore data using natural language queries (NLQ) directly within the embedded portal, without needing SQL knowledge.
What users say about Holistics
Users appreciate Holistics for blending ease of use with developer-level control, enabling highly customizable embedded experiences without compromising maintainability.
- "We needed a BI platform that could handle drill-down analysis, offer a semantic layer for consistent metrics across different data sources, and give end-users more self-service capabilities. And so far, Holistics has checked all those boxes nicely." — Loh Y., Martech Manager, G2, June 2025.
- “We are content with the results because it gave us everything we had in our previous tool, but with significantly better performance, flexibility, and support." — Noe Ocampo, Senior BI Engineer at Datacubed Health, via Holistics.io.
However, Holistics isn't without its limitations. The interface can feel less polished compared to newer BI tools, and there's a meaningful learning curve when setting up data models—something non-technical teams in particular should factor in. "There's a learning curve when it comes to modeling data and setting things up properly, especially for non-technical users. In some cases, performance can slow down with more complex queries or larger datasets," says a verified Holistics user on G2, April 2026.
Holistics pricing
Holistics' standard plans start from $800/month (billed annually). Embedded analytics is available as a separate add-on with custom pricing—contact Holistics for a quote. Embedded plans include unlimited dashboard viewers.
Holistics Embedded vs Metabase Embedded
This is how Holistics and Metabase compare:
- Holistics and Metabase both embed using iframes.
- Holistics includes a full semantic layer with governed, reusable metrics; Metabase provides only basic modeling with limited consistency controls.
- Holistics provides stronger multi-tenant support, reusable components, and richer self-service exploration, whereas Metabase is better suited for simple embedded dashboards.
- Holistics supports Git, CI/CD, branching, and safe deployments; Metabase offers no native version control or structured release workflow.
4. Sigma
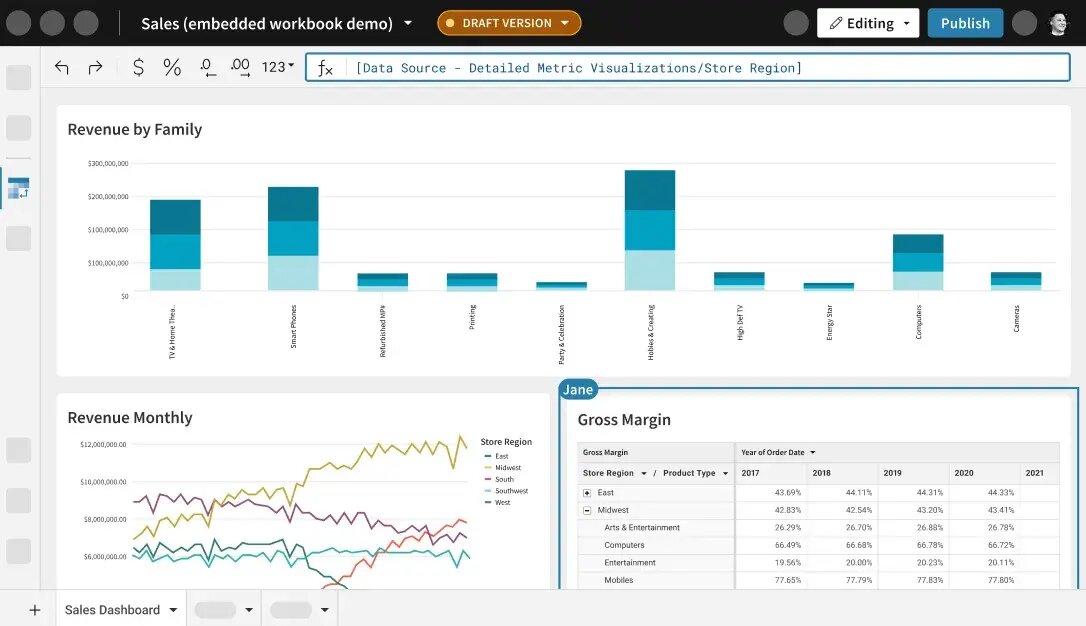
Sigma is a cloud-native analytics and business intelligence platform that connects directly to your data warehouse, offering a spreadsheet-like interface for exploring and visualizing live data. It's a strong alternative to Metabase for teams that need more powerful querying and self-service capabilities.
"It's very easy to integrate, whether you use iframes or the SDK, and you don't have to code everything from scratch—you can simply bring the power of Sigma into your application," says Ibrahim A., Analytics Engineer and Sigma user.
Key aspects of Sigma:
- Connects directly to cloud data warehouses including Snowflake, Databricks, and BigQuery
- Embeds reports and dashboards into other apps via iframe, React SDK, or REST API
- Sigma is fully cloud-based and has a visualization library with multiple chart types
- Users say it’s easy to use from the get-go for building simple dashboards
- Supports RLS and SSO options for data protection
However, like many other BI tools, Sigma has an opinionated UI. You can only access a default menu of predefined charting options that you can’t edit much. This, and embedding through iframes, makes your dashboards look and feel foreign to the rest of your app.
What users say about Sigma
Users value Sigma’s ease of use and performance. However, they would like to be able to edit visualizations easily without having to look for workarounds.
- "Performance lags with complex workbooks and limited visual customization. If your data warehouse is slow or your Sigma workbook has dozens of complex joins and calculated columns, you might experience loading spinners. Fine-tuning the pixel-perfect look of a chart is more restricted in Sigma." — Venkata M., Bench Sales Recruiter and Sigma user.
- "The existing number of native visualizations is limited and some of them are too restrictive." — Mário S., Sigma user, G2, March 2026.
Sigma pricing
Sigma doesn't publish pricing — you'll need to contact sales for a quote. Based on Vendr's transaction data, real-world contracts typically range from $17,390 to $132,507/year with a median of $62,000 (Vendr, 2026). Embedded analytics is only available on the Enterprise tier, where contracts typically start around $100,000.
Sigma vs Metabase Embedded
Sigma and Metabase are both business intelligence platforms, but this is how they compare:
- Metabase and Sigma both embed using iframes; Sigma also offers a React SDK and REST API for more custom integrations
- Metabase is more affordable than Sigma due to its open-source option
- Sigma is cloud-based only while Metabase can be hosted on the cloud or on-premise
- Sigma is easier to use and makes it easier to process complex queries
- Both Metabase and Sigma provide limited customization options and won’t feel native when embedded in your app
Pro tip: If you don’t mind sacrificing customization options and want a cheaper solution, stick with Metabase. Sigma's contracts typically start at $17,390/year versus Metabase's $100/month entry point. However, Sigma is easier to use and overall slightly more customizable than Metabase, so it’s worth considering if you have the budget.
What about custom-built embedded analytics?
If you have the capacity to put together a team of developers, or you need to build a quick static dashboard, building custom user-facing analytics internally can be a good option. Doing so gives you total autonomy over the user experience, security, design, and performance.
In fact, the best examples of user-facing analytics that you can find in the apps you use, all stem from custom development. No BI tool will offer the same levels of customization and a native feel. But we know how costly and time consuming it can be to develop analytics experiences from scratch.
The build vs buy dilemma is real—which is precisely why we built Embeddable: to ensure you don't compromise on user experience and native feel due to resource limitations.
With Embeddable, your engineers define data models and components in code, while Embeddable handles the backend infrastructure—security, performance, multi-tenancy, and scale. This gives you fast-loading analytics and full control over user experience at the price of a SaaS tool, allowing you to build and buy at the same time. If you're weighing your options, o
Curious to learn more? Read the developer docs.
How to choose your embedded analytics solution
If you’re not fully convinced by Metabase for embedded user-facing analytics, here’s a quick guide to make a decision based on our shortlist:
- You want fully bespoke user-facing analytics but don’t have the time or budget to start from square one, consider Embeddable. It's the only embedded analytics platform on this list that gives you complete control over the user experience through code. It’s also accessible for any team member to build analytics experiences without coding, using a straightforward point-and-click interface.
- You have developer capacity and want an open-source solution: Preset has a steep learning curve but since it’s built on top open-source tools, it allows more customization than traditional BI solutions.
- You’d be happy with Metabase but need custom formulas and complex queries: Metabase and Sigma are similar products, but Sigma is better performing, especially for complex analysis. If you're also evaluating enterprise tools like Tableau or Power BI for embedded use, keep in mind that dedicated embedded analytics platforms like Embeddable will offer a more native product experience at a lower total cost.
Top tip
For more on how embedded analytics differs from traditional BI tools like Metabase, see our guide to embedded analytics vs business intelligence.
Before developing Embeddable, we had hundreds of conversations with Trevor.io users. As a result, we understand the complexities of building remarkable analytics experiences from scratch and the frustrations of having to deal with unfit tools.
Embeddable offers the best of both worlds: the customizability of custom-built data analytics and the simplicity of a plug-and-play tool. Plus, we use next-generation embedding so your code can sit right in your DOM—all at a flat monthly price.
Frequently asked questions about Metabase Embedded Analytics alternatives
What are the top alternatives to Metabase for embedded analytics?
The top alternatives to Metabase for embedded analytics include:
- Embeddable (a developer toolkit for building native, customer-facing analytics experiences in code)
- Preset (fully-managed version of Apache Superset)
- Sigma Computing (a BI Tool with embedded capabilities)
Is Metabase better than Tableau for embedded analytics?
Metabase is better than Tableau in terms of ease of use and pricing. However, Tableau offers a bigger visualization library and makes it easier to process highly complex queries. If your goal is user-facing analytics, there are other, even better Tableau alternatives available such as Embeddable, Power BI Embedded, or Luzmo.
Why would someone look for a Metabase alternative for embedded analytics?
Metabase has limited customization and embedding options, which can be restrictive for SaaS products. Teams often need more control over branding, user access, and multi-tenancy.
What makes Embeddable a strong Metabase alternative?
Embeddable offers full UI control, secure multi-tenant data isolation, and is purpose-built for embedding into SaaS products. It doesn’t require maintaining your own BI infrastructure.
Do Metabase alternatives support self-service analytics?
Some do, but many require developer input. Embeddable supports self-service dashboards while giving you full API and SDK access to customize the experience.
References
- Embeddable - Top Embedded Analytics Platforms for User-Facing Analytics: https://embeddable.com/blog/top-embedded-analytics-platforms-for-user-facing-analytics
- Woopra - Embedded Analytics: https://www.woopra.com/blog/embedded-analytics
- Holistics - Embedded Analytics for SaaS: Express Guide (2026): https://www.holistics.io/blog/embedded-analytics-for-saas/
- GoodData - Which Embedding Method Is Right for You? (iframe, Web Components, React SDK): https://www.gooddata.com/resources/which-type-embedded-analytics/
- Anchor Digital - The Impact of Using iFrames on a Website: https://anchordigital.com.au/articles/the-impact-of-using-iframes-on-a-website
- Springboard Digital - Why iFrames Are Bad for Your Website: https://springboard-digital.com.au/why-you-shouldnt-use-iframes-on-your-website/
- Wikipedia - Embedded Analytics (Overview): https://en.wikipedia.org/wiki/Embedded_analytics
- CoEnterprise Blog - Top 5 Reasons to Adopt Embedded Analytics: https://www.coenterprise.com/blog/the-top-5-reasons-to-adopt-embedded-analytics
- G2 - Metabase Reviews: https://www.g2.com/products/metabase/reviews
- G2 - Sigma Reviews: https://www.g2.com/products/sigma-computing-sigma/reviews
- G2 - Preset Reviews: https://www.g2.com/products/preset/reviews
- Reddit - User Comment: https://www.reddit.com/r/BusinessIntelligence/comments/vem2oe/comment/icqwesd/