Charting libraries can help you deliver customer-facing analytics projects like dashboards and reports, but there are a lot of them. Choosing the right one for your needs is important.
Plus, a good charting library will give you a helping hand on the front-end UX and UI — but building a great analytics experience that checks all the right boxes is easier said than done.
Among the many available tools, D3.js stands out for its flexibility and power, with many considering it one of the best Javascript charting libraries available. Although you could argue that it’s not really a charting library at all (more on that below).
Despite its strengths, D3 can be challenging to work with, especially if your goal is to create an end-to-end analytics solution that includes advanced features like drilldowns, user interactivity, exporting, and scheduling reports.
In this guide, you’ll learn how to build dashboards with D3 and understand all its benefits and limitations. You’ll also find out how Embeddable can simplify the process, offering a seamless way to incorporate custom charts into your application without a heavy engineering burden.
Build pixel perfect dashboards faster with D3 and Embeddable. Learn more.
What is D3?
D3.js (Data-Driven Documents) is an open-source JavaScript library that allows developers to create dynamic, interactive, and highly customizable visualizations using web standards like SVG, HTML, and CSS.
Unlike pre-built chart libraries, D3 gives developers complete control over the look, feel, and behavior of their visualizations, making it ideal for custom or complex use cases where traditional charting libraries fall short.
D3 achieves this flexibility by having no concept of charts at all. Instead, it operates at a lower level with a ‘variety of primitives’ that can be used to construct charts. That’s why some might argue that it’s not really a charting library at all.
This could be a negative for teams wanting to pick from pre-built charting components and save the engineering time. Or it could be a big plus if the pre-built charts you find elsewhere simply don’t cut it.
Key features of D3 include:
- High level of customization and flexibility.
- Open-source and free to use.
- A large community with abundant resources, tutorials, and documentation.
- Integration with other front-end frameworks like React and Angular.
What charts does the D3 library contain?
With D3, the only limit to the types of charts and visualizations you can build is your imagination. The library gives you full control over the look, feel, and behavior of the charts, meaning that you can customize each one down to the pixel.
Common types of charts that you can build with D3 include:
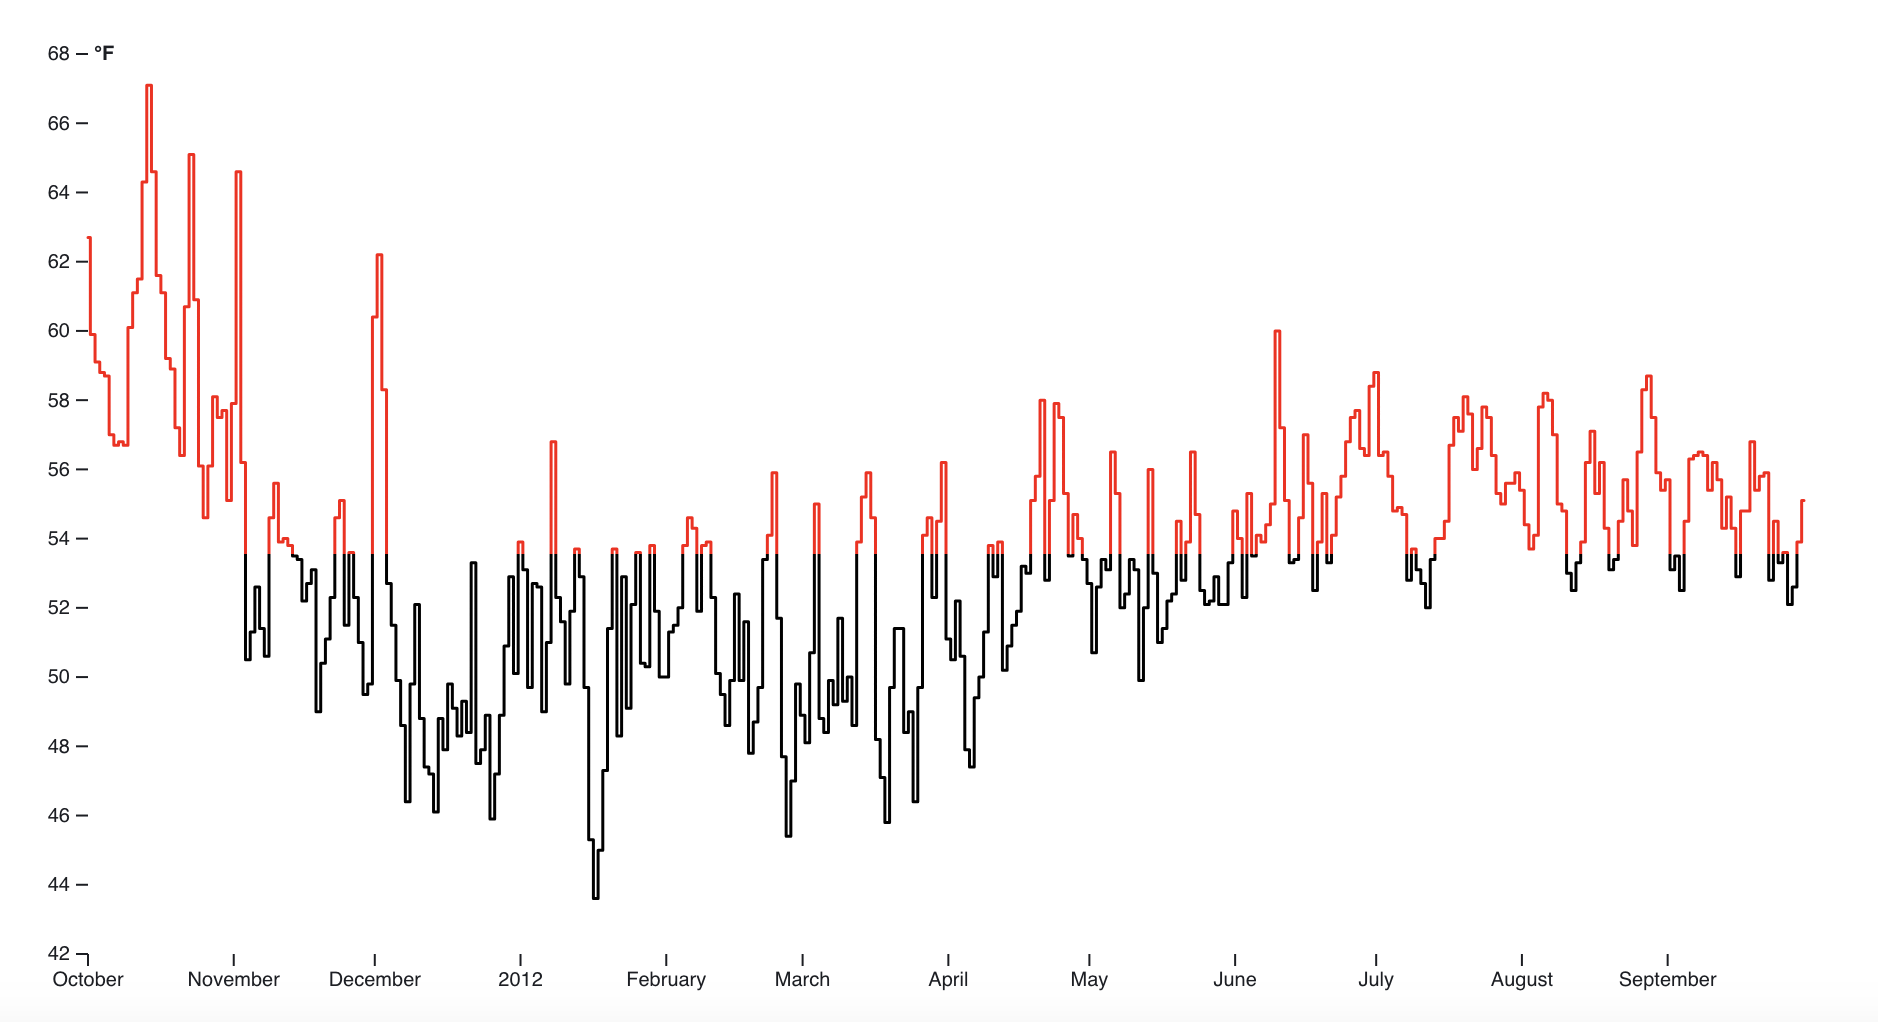
Line charts—Ideal for displaying trends over time with various customization options available in D3. The line chart in the example below has an added twist. The line changes color to red when the value is above a certain threshold.

- Pie charts—Best for representing proportions or percentages.
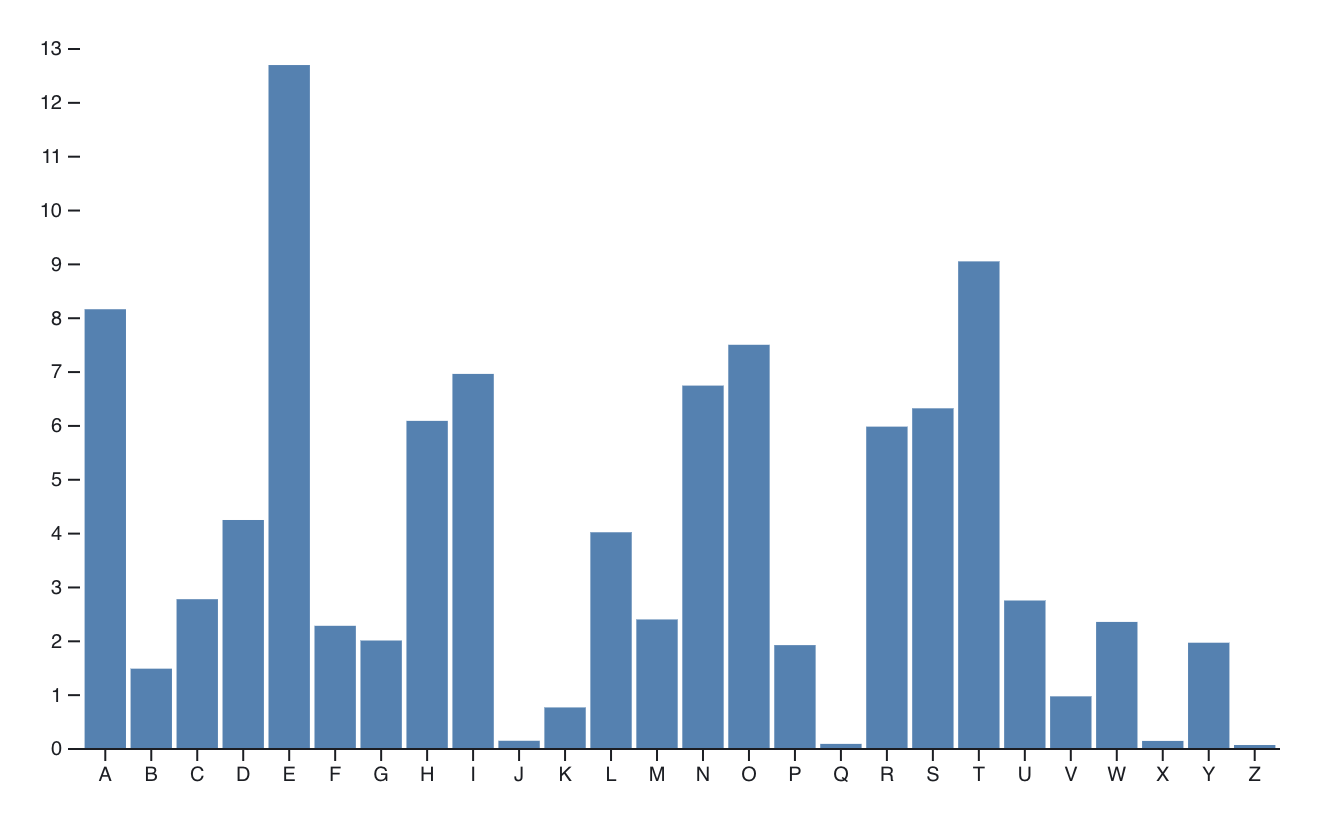
- Bar charts—Suitable for comparing discrete categories. The example below presents a simple bar chart displaying multiple variables based on their name instead of their value.

- Scatter plots—Useful for showing relationships between variables.
- Heatmaps—Good for displaying matrix data and showing intensity.
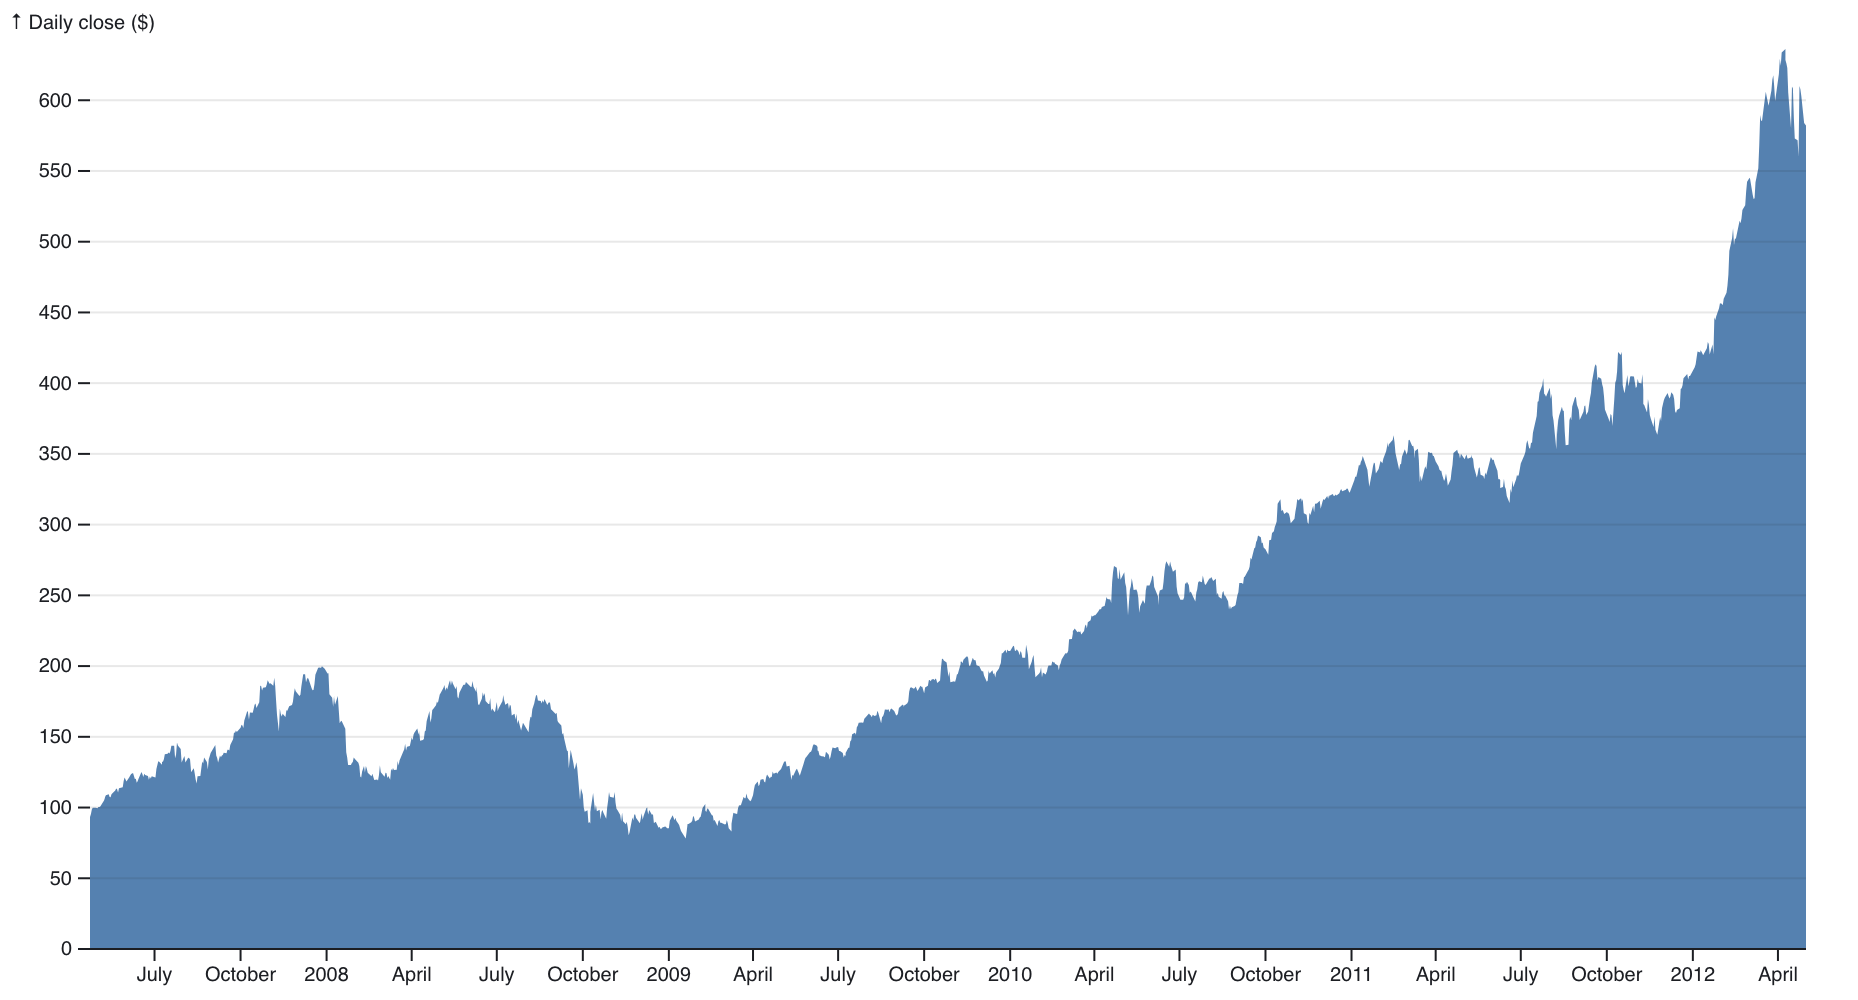
- Area charts—Combines features of line charts and bar charts to show cumulative data. The area chart pictured below shows the daily close of Apple stock for a given period. The x-axis represents time, while the y-axis has the stock values.

- Tree diagrams—For hierarchical data structures.
- Force-directed graphs—Often used to show network relationships.
You can customize each of these charts, not just in terms of aesthetics but also in terms of interaction. Plus, D3 allows you to add hover effects, click events, transitions, and even real-time data updates.“There’s a virtually-unlimited scope for what you can create with D3,” says Harry Marshall, Co-founder of Embeddable. “But it does require more input than charting libraries that provide pre-canned charts to use directly in your project with some simple styling changes.”
What frontend frameworks can you use with D3?
D3 is highly adaptable and you can use it with various front-end frameworks. Its flexibility allows for seamless integration, though the level of effort needed may vary based on the framework you use.
You can use these frontend frameworks with it, too:
- React.js—The most commonly used framework because of its component-based architecture.
- Vue.js—An alternative to React that pairs well with D3 for building complex UIs.
- Angular—Known for its rich ecosystem, Angular can work with D3, though integration may require more boilerplate.
- Svelte—A lightweight framework with easy integration into D3.
- Vanilla JavaScript—D3 works well with no framework, too.
Pairing D3 with frameworks like React provides a more organized and modular approach to building complex, interactive visualizations. This helps maintain scalability and reusability of components, especially in large interactive dashboards or applications.
What do users say about D3?
D3 is generally liked by developers and data visualization experts for its flexibility and customization options. Some users, though, complain about the steep learning curve and complexity. Given that you have to build charts from a lower-level of elements (‘primitives’) it can feel excessive when working with simple charts.
For instance, one user on Reddit says, “D3.js is overkill for a lot of situations—you honestly won't need that level of interactivity and you won't need to build your visualization from the ground up most of the time.”
Another user says, “If you need to create something impressive and complex, then you'll probably need D3.js. But in most everyday use cases, it will be just a burden.”
In most cases, D3 also requires you to learn the Observable platform, which many users feel is unnecessary and limits the freedom with which they can apply D3 to their projects.
“The whole point of having a javascript engine is so that we can use data from our web applications,” says one user. “I’m not interested in a dynamic view of static data, I’m interested in a dynamic view of dynamic data.” Having to get to grips with Observable adds to an already relatively steep learning curve.
So, if you’d rather swerve that steep learning curve, you could go for a library like Chart.js or Material UI, which is easier to set up and offers more pre-built chart types. If you’ve got capacity and willingness to overcome the learning curve, read on to find out how to use D3.
How to use D3
Next up, let’s explore the process of using D3 step by step, from installation to building and customizing your dashboard components.
1. Installing D3
The first step to building dashboards with D3 is adding the library to your project. There are multiple ways to get started with D3, depending on whether you’re using Vanilla JS, Svelte, React, or installing via npm.
Using npm in a JavaScript/React Framework
- Install D3: Use `
npm install d3` or Runyarn add D3 - Import and Use: Import specific D3 modules in the JavaScript file, e.g.,
import { scaleLinear } from 'd3-scale'. Or Import the whole library usingimport * as d3 from "d3" - Rendering: Use
useEffect(for React) to handle D3's DOM manipulations inside your components.
Note: Great for projects using modern frameworks like React, Vue, or Angular; can work with other npm packages easily.
Direct `<script>` Tag in HTML (CDN)
- Include D3: Add `
<script src="https://d3js.org/d3.v7.min.js"></script>` in the HTML `<head>`. - Access in JS: D3 functions become globally accessible in the `
<script>` tag or inline JavaScript.
Note: Ideal for small projects or prototypes not using bundlers. Incompatible with module-based frameworks like React unless adapted with window.d3.
Bundlers like Webpack without npm
- Download D3 Source: Add D3 as a local file and configure Webpack to bundle.
- Usage: Import D3 in the project as:
Note: Useful for custom bundling needs or projects where direct npm isn’t available.
You can find further details on D3’s official ‘Getting Started’ page, which also includes the option to use D3 in Observable Notebooks.
This will install the core D3 modules, which you can start importing into your project files. Since D3 is modular, you can choose to import only the specific parts of the library you need, helping keep your bundle size small.
Advanced: Creating a basic DOM structure
Some D3 components manipulate the DOM directly using standard web technologies like SVG. So, before adding any chart, you need to create an SVG element in your HTML.
This code snippet creates an SVG element inside the body of your HTML page. The width and height attributes define the chart’s canvas size.
4. Style and customization
Next, you can customize your dashboards depending on your needs. D3 offers scaling and axis functions, transitions, and more, which help translate raw data points into pixel values suitable for display.
Plus, D3 can handle complex animations and interactions, which makes it especially useful for dashboards where data will be updated in real time or at regular intervals.
To style D3 elements in your codebase, you have several options:
- Inline Styles with D3: Set styles directly with
.style()in your D3 chain, e.g.,.style("fill", "blue"). - CSS Classes: Assign CSS classes to elements with
.attr("class", "myClass")in D3, then define styles in your CSS file. This keeps styling separate and manageable. - SVG Attributes: Use
.attr()to set SVG-specific attributes like fill and stroke, especially for shapes like circle or rect. - Dynamic Styles: Apply conditional styling based on data, allowing for dynamic updates like color changes on hover or specific data thresholds.
5. Turn them into an interactive dashboard
Once you’ve crafted your charts and added interactivity, there are still a few things to consider to ensure you’re not only presenting frontend charts, but also filling them with data (quickly). Ideally, you’ll also give your users a good level of interactivity, too.
For a customer-facing dashboard in your application, you’ll likely want it to load fast, be secure, and dynamically load the relevant data for the specific customer who is logged in.
Data presentation: Now you have some basic charts, and you need some data to fill them with. You can connect D3 visualizations to a database via APIs for real-time or dynamic data.
This typically involves writing backend code to serve data to your frontend D3 charts and will require some data modeling to ensure that the data is clean enough to present.
Note: You may want to explore the use of a Semantic Modeling Layer to ensure that the data you’re serving is consistent and the data presented doesn’t inherit an internal naming convention that users should never see e.g. ‘USD_XPayments_’, when simply ‘Payments’ would be best to display.
Performance/Speed: Serving data to users is one thing, but serving it to them quickly is another. You’ll want to consider which database, or warehouse or lake you’ll be connecting with, and whether it will run queries fast enough to return data before your customers get frustrated.
Another option would be to use one or more caching layers to ensure that the data is pre-aggregated and ready to be served immediately to the frontend.
Interactivity: A static dashboard can be insightful, but the power of data is multiplied significantly if the data consumer (your customer) can interact with the data. For example, they could apply filters, select date ranges, drill down into the data, export as csv, png, or pdf. Even better if they can personalize their own view of the dashboard.
All of this can take a lot of engineering time and effort to achieve. When users come back asking for more changes and optimisations, it can all become a heavy burden on your engineering team.
What if there was a better way? 5 benefits of headless embedded analytics
D3 offers a lot of flexibility but building and maintaining genuinely delightful dashboards with it can take a lot of time and effort.
From setting up the initial visualization to adding advanced features like real-time updates and drilldowns, the development process can be challenging. That’s where headless embedded analytics can offer a huge advantage.
With a solution like Embeddable, developers can offload many of the more complex and time-consuming tasks associated with building dashboards, just like using any embedded analytics tool, but with the added benefit of having access to the code for full UX and UI control.
Instead of developing each feature manually, Embeddable allows you to import your charts from D3 or any other charting library while gaining access to advanced analytics features out of the box.
But how can headless embedded analytics help? There are several key benefits.
- Retain full control over the frontend UX/UI. You can still use D3 to create customized charts and get the most out of its features. Pair it with headless embedded analytics, and you have a simple way to deliver a seamless, on-brand experience for your customers.
- Charts load natively. No need for iframes or third-party widgets—everything is fully integrated into your app for a seamless (and quick-to-load) experience.
- Fully native look & feel. Maintain the exact look and feel of your front end, without compromises.
- Easily add interactivity. Enable end users to export, drill down, and build their dashboards with built-in features you can enable with a few clicks.
- End-user personalization. Headless embedded analytics also allow for user-specific configurations, letting end users customize their dashboard views without additional coding.
How to use D3 with Embeddable
Once you’ve developed your charts using D3 and styled them to look and feel seamless in your application, Embeddable can help you with handling the backend, security, performance and maintenance of the dashboards in your application.
Here’s how you can use D3 and Embeddable together:
1. Create your D3 visualizations
Build your visualizations with D3 as described above, using your custom data and configurations.
2. Push to Embeddable via the SDK
Embeddable’s CLI can then bundle up this code. Your LineChart will appear in Embeddable’s no-code builder for the rest of your team.
This step integrates your visualization with the Embeddable platform as a version, enabling you to connect it to your data models and build out beautifully bespoke dashboards and analytics experiences in a no-code builder environment.
Note: Our SDK uses the Vite Javascript bundler behind the scenes to build the bundle. If it can be built by Vite (which mostly everything can), it can be used in Embeddable (typescript and all your favorite CSS frameworks work out-of-the-box).
3. Craft your dashboards
Use the no-code builder to combine your charts with data models and build out dashboards with ease. Simply toggle on interactions between charts and controls like filters and turn on advanced features like exporting, enabling your customers to build their own dashboards.
4. Embed your dashboard
Finally, embed your configured dashboard into your web application by using Embeddable’s web component. Simply follow the instructions to add a script tag, and the web component to render the full dashboard wherever you like on the page.
The charts and data will then load natively in the DOM, giving you a completely native feeling experience, and enabling bi-directional communication between the charts and your application.
You can also easily enable row-level-security (allowing you to render different data on the dashboard for different users).
See the Embeddable docs for more information and code examples.
The Result
Using D3 with Embeddable means you get a head start with the frontend charting components from D3’s open source library. You save a bunch of engineering time vs. having to bring those charts to life yourself. That way, you can achieve feature-rich dashboards while still maintaining full control over the visualization experience
D3: Is it right for you?
Many developers like D3 for its flexibility and customization options. It’s great for developers who need to build highly specific, interactive charts and are happy to invest time in learning the library.
D3 has a large ecosystem and an active community, so finding templates and help, even for beginners, is relatively easy. It comes with a wide range of chart types, from bar charts to complex network diagrams.
On the other hand, D3 requires a deep understanding of Javascript, SVG, and DOM manipulation. It has no pre-built components or charts, so it’ll require more effort, especially at the start of a project.
Building advanced features, such as exporting or user interactivity, without using something like headless embedded analytics, will be a drain on your time and resources. But, pairing a powerful tool like D3 with Embeddable will streamline the process.
With Embeddable, you get the best of both worlds: D3’s impressive charting library and the flexibility, security, and ease of use of headless embedded analytics. Get in touch so we can show you!
Build pixel perfect dashboards faster with D3 and Embeddable. Learn more.
Frequently asked questions about D3
Is D3 the best visualization library?
D3 is one of the most powerful and flexible visualization libraries available, especially if you need highly custom visualizations. However, it may not be the best option for simpler use cases where a more pre-configured library, like Chart.js or Material UI, could suffice.
What are the disadvantages of D3?
D3’s biggest disadvantage is its complexity and steep learning curve. It also requires more manual coding compared to other charting libraries, which can be time-consuming. Plus, it doesn’t offer built-in advanced features like exporting or scheduling, which developers need to build from scratch.
Can I use D3 with React?
Yes, you can use D3 effectively with React, but you’ll need to manage how D3 manipulates the DOM, as React uses a virtual DOM.
Many developers overcome this by using libraries like react-faux-dom or D3-React bindings, or by letting React manage the DOM and using D3 for calculations and rendering.You can attach a ref to an element and pass it to D3 in a useEffect hook.Embeddable is another great solution here, as it can load the charts natively in the DOM.


.jpg)


