.jpg)


With a clever charting library on-side, there’s no need to build charts from the bottom up in vanilla JavaScript. It’s just a matter of finding the right library for your project—one that can help you code beautiful, responsive charts for a user experience the product team will be proud of.
In this article, you’ll find six of the best charting libraries, recommended by Lucas van Egeraat, CTO at Open Cluster. Lucas has been working closely with the Embeddable team as a TypeScript engineer.
You can use any charting library with Embeddable, which takes your bespoke charting components and allows you to create, curate, and maintain remarkable analytics experiences in your website or application, in only 10% of the time (but we’ll get into that later!)
Each library on this list has been evaluated according to its functionality with TypeScript and popular JS frameworks, as well as its ease of use and customizability. Once you’ve finished reading, you should have a better understanding of the most popular libraries available, and which one is right for your project.
How to choose a charting library
When deciding on your charting library, we recommend keeping these considerations in mind.
Check out its compatibility
Naturally, it’s preferable if your chosen JS library uses the same frontend framework as the rest of your app. Apart from Recharts, which is a React library, all the libraries on our list are compatible with most popular frameworks. Their APIs make it easy to integrate charts into your apps or web pages.
Next, find out if your chosen library is compatible with TypeScript, unless you’re happy working directly in JavaScript. “Support for TypeScript nowadays is kind of a must for any serious charting library,” says Lucas. “Basically it’s just a better, more professional version of JavaScript.”
Know whether you want open-source or paid
When there are so many open-source charting libraries available, you might wonder why anyone would bother paying for one.
Paid libraries can have their advantages, such as having a reliable release cycle with frequent bug fixes and updates that improve their compatibility. It’s also possible that the licensing restrictions on some free libraries will have usage limitations that conflict with your project.
That said, there are some very strong contenders available for free, with huge communities of users behind them. That’s why every option on our list is open-source, apart from Highcharts.
Product tip: you can use any component library to create analytics experiences in Embeddable, and you'll get a bunch of charts out of the box (in code), too.
Other considerations
It’s worth scoping out the details of your project before choosing your charting library. For example, if you have more junior devs or tight deadlines, you might need to sacrifice highly customizable, interactive charts in favor of a simpler library with a low learning curve.
When choosing your library, first ask yourself:
- How steep is the learning curve?
- Does it have decent documentation and tutorials?
- Does it cover all the chart types I need?
- Is it mobile responsive?
- Does it use SVG or Canvas?
7 Best charting libraries (for TypeScript or JavaScript)
After reviewing all the JavaScript libraries out there, Lucas narrowed it down to the top six, which you can find below. Before we consider each one in detail, here’s a quick comparison table to give you an overview:

D3.js

Unlike most libraries, D3 doesn’t have predefined chart components, which means the variety of charts you can create is pretty much unlimited. Users especially recommend it for custom heatmaps, effects, and transitions.
In terms of customization, you won’t find a better library out there, but devs can either make or break their career trying to master it. Lucas calls it the “grandaddy of charting libraries”—it’s very powerful, but also incredibly tough.
While D3 can technically handle projects of any scale, it takes more effort to build complex charts and you’ll need to implement mobile-responsive controls manually. It also has fairly disappointing TypeScript support, as it’s focused more on building with vanilla JavaScript.
In terms of developer time, D3 is potentially one of the least scalable charting libraries. But if you have a D3 expert on board, you’ll be able to create any chart your design team can imagine.
Frameworks
D3 can be used with any framework.
TypeScript
D3 has TypeScript definitions, but they’re not great. Lucas says, “It’s not impossible to write the right code, but it’s harder than it should be. This bothered me so much that I had to mark it down for being user-unfriendly.”
Reviews
Users appreciate D3’s useful demos but note that the learning curve for this library is very steep. It’s widely acknowledged that creating charts with this library eats a lot of dev time.
However, there are some reviews that highlight how D3 was launched in 2011, and while it was innovative then, it's pretty outdated now. They call D3 complicated and heavy, with modern charting libraries doing the same work with less heavy lifting.
G2 rating: 4.2/5
GitHub stars: 106k
“In terms of visualization, you can pretty much do anything! It is SVG based which is way better than Canvas. But it’s not a plug-and-play library. You have to spend some time learning it to actually get meaningful results. - Vikhyat G, Associate Systems Programmer and G2 reviewer
Pricing
Open source, licensed under BSD-3.
Other considerations
- Customization score: 5/5
- Ease of use score: 1/5
- Mobile responsiveness: Manual
- Supports SVG: Yes
- Supports Canvas: No
Explore our full guide on How to Build Dashboards with D3.
ECharts

ECharts joined Apache’s product range in 2018, and has rapidly grown in popularity since then. It’s a strong open source library that’s known for being high-performing.
Even in the face of low bandwidth connections, ECharts offers fast-loading data visualizations and a pretty smooth end-user experience on most browsers. That’s partly down to its incremental approach to rendering. It also performs well on mobiles and portable devices, thanks to having a small, modular package.
Of the free libraries on this list, ECharts has the widest range of chart types available, second only to D3. Unlike D3, ECharts also ranks highly on the user-friendliness scale, although some users find ApexCharts and Chart.js even easier to use. You can check out some examples of basic charts on ECharts.
Frameworks
ECharts works with most popular JavaScript frameworks, including Angular, React, and Vue.js.
TypeScript
TypeScript definitions are available,
Reviews
There aren’t enough reviews on G2 or Product Hunt to give an accurate rating but ECharts is popular on GitHub, with even more stars than Recharts, Highcharts, and ApexCharts.
GitHub stars: 56.7k
“It powers the majority of the charts in our analytics product with the exception of grids and maps. ECharts offers all a ton of options out of the box to configure our charts and the necessary hooks to extend it when necessary with things like echarts.registerLayout.” - Jonathan Avila, Senior Software Engineer and GitHub commenter
Pricing
Open source, licensed under Apache 2.0
Other considerations
- Customization score: 4/5
- Ease of use score: 4/5
- Mobile responsiveness: Built-in
- Supports SVG: Yes
- Supports Canvas: Yes
Explore our full guide on How to Build Dashboards with ECharts.
Chart.js

Chart.js is by far the most popular charting library, coming in at over two million weekly downloads. It’s widely considered to be a beginner-friendly choice, with a simple, intuitive programming interface. Here’s a real-time demo.
Chart.js strikes a fairly good balance between simplicity and customization, offering a decent variety of charts. However, it’s missing bullet, funnel, Gantt, or network charts (unlike ECharts which includes them all for free).
Like most of the options on this list, Chart.js is mobile responsive by design. Charts will automatically adjust according to the size of the screen, whether that’s on tablets, mobile, or desktop devices. You can also configure its responsive settings to dictate how charts behave at different breakpoints.
Note that this library can have limitations when dealing with highly customized charts and complex data, so you might experience performance issues on large-scale projects. For that reason, we’d recommend using it for small to medium-scale projects or large projects that only require simple visualizations.
Frameworks
Chart.js works with most JavaScript frameworks including Angular, React, and Vue.js. It’s especially popular among React developers, thanks to the availability of React wrappers.
TypeScript
TypeScript definitions are available.
Reviews
The standout sentiment from user reviews is how easy Chart.js is to use. However, they do also note the lack of support for 3D chart types.
G2 rating: 4.4/5
GitHub stars: 62.1k
“Updating charts as underlying data changes is very seamless which makes it responsive. It offers various customization options and types of charts, allowing us to make the UI much more attractive.”—Prateek A, Senior Software Engineer and G2 reviewer.
Pricing
Open source, licensed under MIT.
Other considerations
- Customization score: 4/5
- Ease of use score: 4/5
- Mobile responsiveness: Built-in
- Supports SVG: No
- Supports Canvas: Yes
Explore our full Chart.js guide.
Highcharts

Highcharts is a highly configurable JS chart library. With it, you get the option to set up event-driving callback and advanced visualizations, like annotation support, panning, dynamic display, zoom, and series-based drilldown.
This is the only paid solution on our list, but it was worthy of a mention because it’s also one of the most easy to use—matched only by ApexCharts. The difference is, Highcharts has a few components that ApexCharts lacks, including bullet, funnel, Gantt, network, and 3D charts.
However, you might need to pay for additional packages to get exactly what you’re looking for. The Highcharts Core package includes all the essentials (like line, bar, area, and pie charts) but Maps, Gantt, and Stock chart packages are all extra. In terms of cost, this makes Highcharts somewhat less scalable, depending on the budget available for your project.
The budget is in fact, the only reason why many Highcharts users look for alternatives:
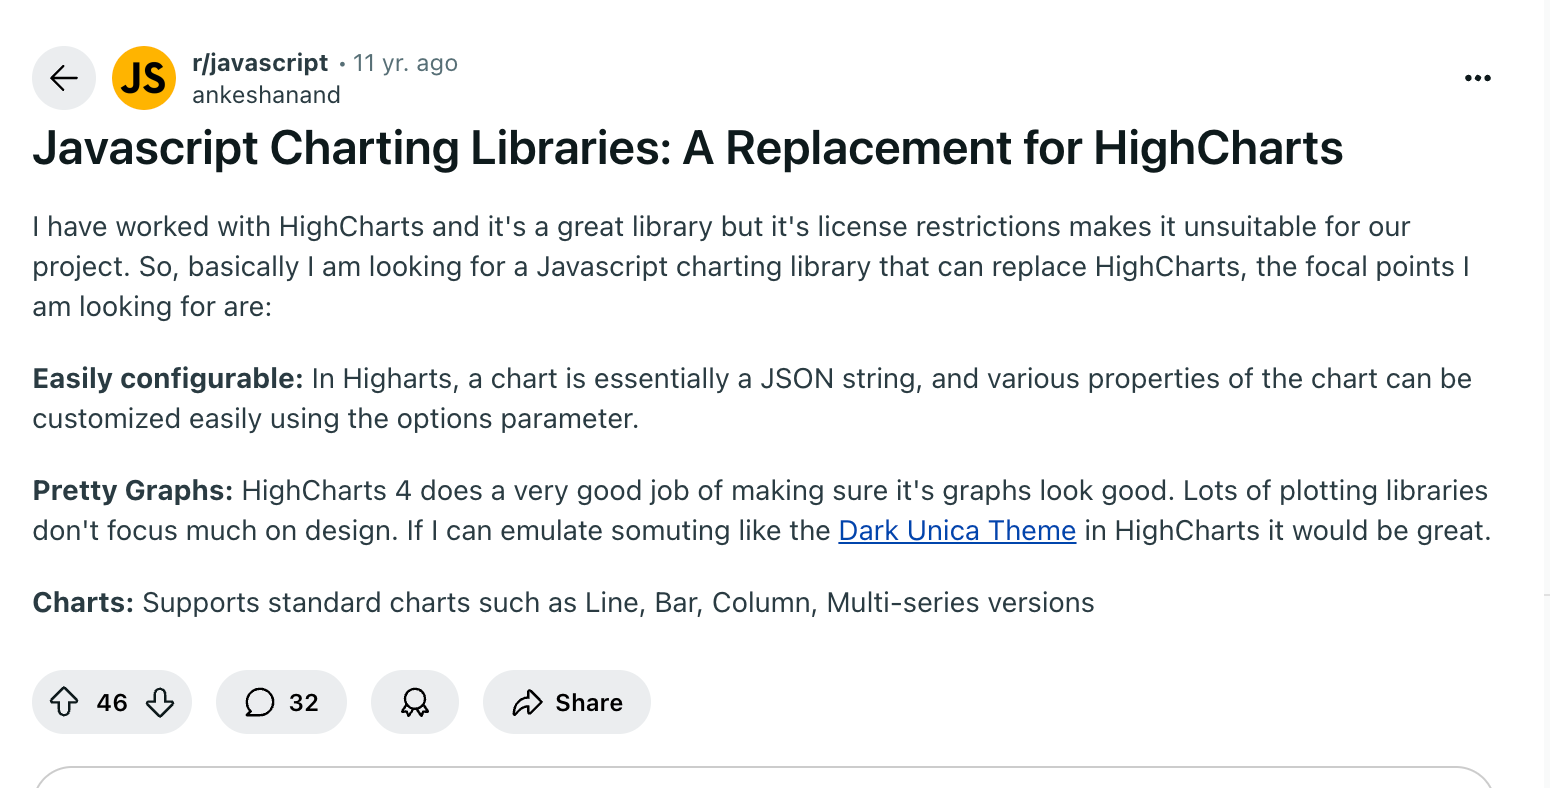
Frameworks
Highcharts works with most popular JavaScript frameworks, including Angular, React, and Vue.js.
TypeScript
TypeScript definitions are available.
Reviews
Aside from Highcharts’s ease of use, users are most impressed by how comprehensive its range of chart types is.
G2 rating: 4.5/5
GitHub stars: 11.5k
“What I find truly appealing about Highcharts is its incredible versatility in chart creation. It offers a wide array of options, allowing me to generate almost all types of charts effortlessly. But it could be a bit faster, especially when handling large datasets or generating complex visualizations.”—Akash N, G2 reviewer.
Pricing
You can try Highcharts entirely for free, but you’ll need to buy a license if you want to publish your charts anywhere. To give you an idea of the cost, we’ve broken down the annual pricing model. The fees below are paid per seat:
- Internal: $160
- SaaS: $316
- SaaS+: $788
Other considerations
- Customization score: 4/5
- Ease of use score: 5/5
- Mobile responsiveness: Built-in
- Supports SVG: Yes
- Supports Canvas: No
See our guide on How to Build Dashboards with HighCharts.
Recharts

If you’re using React, this library is a popular choice. Recharts has been around for nearly a decade, so it’s fairly stable and has a large community of users to provide support.
This library is built to use React’s virtual DOM, rendering only the parts of charts that have changed. As a result, it’s pretty fast. Performance is strong, and it can handle large data sets, but it doesn’t offer the same level of customization as D3 or ECharts. For that reason, it’s recommended for small to medium-sized React projects. To see for yourself, check out this example chart using live code.
Works with
Recharts is designed specifically for React, so it’s only suited to projects using this framework.
TypeScript
Recharts is heavily based on D3.js, which means it faces the same issues with TypeScript. “You try to write good code, but TypeScript keeps throwing errors because of bad or unclear typing. So, instead of helping you out, TypeScript feels like it’s against you,” Lucas remarks.
Pricing
Open source, licensed under MIT
Reviews
Unfortunately, there aren’t any reviews on G2 or Product Hunt for Recharts yet. That said, it’s pretty popular on GitHub. Plus, it sees over a million weekly downloads, making it more popular than Highcharts, ECharts, and ApexCharts.
GitHub stars: 21.1k
Other considerations
- Customization score: 4/5
- Ease of use score: 4/5
- Mobile responsiveness: Built-in
- Supports SVG: Yes
- Supports Canvas: No
Explore our guide on How to Build Dashboards with Recharts.
SciChart

SciChart is a strong charting library focused on ease of use and deep customisation - with every API endpoint being customisable (i.e. rendering, series, axis, layout, annotations, interactions).
170 examples with source code, hundreds of documentation pages, free AI assistant, and an MCP Server are all provided to developers to help them build easily with SciChart.
A nice touch that is missing in many other charting libraries is the existence of 3D charts, which can be very valuable if needed.
Works with
SciChart works with React, Angular and Vue.
TypeScript
TypeScript definitions are available.
Pricing
SciChart starts from $1349 per developer for licensing, with a free community edition for personal use. A small business discount of 50% is available, and free educational / academic licensing.
Reviews
At reviews.io SciChart is rated 4.8/5.0 by nearly 500 reviewers, and at G2 4.4/5.0 (only a handful of reviews)
Other considerations
- Customization score: 5/5
- Ease of use score: 5/5
- Mobile responsiveness: Built-in
- Supports SVG: No. But is WebGL.
- Supports Canvas: No
ApexCharts

ApexCharts was first released in 2018. It’s one of the least “mature” and yet most easy to use options on the list. Thanks to being open source and exceptionally user-friendly, ApexCharts has boomed in popularity in recent years and gets far more weekly downloads than more established tools like Plotly or FusionCharts.
Users also recommend it for the level of chart documentation and live examples available, which show exactly what you can achieve with this library. Like most of the libraries on this list, it has built-in mobile responsiveness and automatically adjusts chart layouts for different devices.
The only drawback is that it lacks a few chart types, including bullet, funnel, Gantt, network, and 3D charts. If ease of use isn’t a major priority, you could go for ECharts, which is still fairly user-friendly and has an even wider range of chart types.
Frameworks
Works with most popular JavaScript frameworks, including Angular, React, and Vue.js.
TypeScript
TypeScript definitions are available.
Reviews
Take the 5/5 with a pinch of salt, as there are only nine reviews for ApexCharts on Product Hunt and none on G2. However, all existing reviews are overwhelmingly positive.
Product Hunt rating: 5/5
GitHub stars: 13.2k
“The library plays very well with all web frameworks, has clear boilerplate code snippets you use to get going fast and well documented.”—Gilbert Mpanga, Full Stack Engineer and Product Hunt reviewer
Pricing
Open source, licensed under MIT
Other considerations
- Customization score: 4/5
- Ease of use score: 5/5
- Mobile responsiveness: Built in
- Supports SVG: Yes
- Supports Canvas: No
So, which is the best library for your project?
If you’re looking for fully custom charting components and your dev team can handle a very complex library, D3.js is the best choice on this list. However, it’s not well suited to TypeScript and can require much more manual coding than other libraries.
To shorten dev time and maintain a fairly high level of customization, we’d recommend choosing either ECharts or Highcharts. Both libraries score pretty highly on the ease-of-use scale and offer the broadest range of chart types. Plus, they’re compatible with TypeScript and offer built-in mobile responsiveness.
We know (from running Trevor.io) that building dashboards can be a deceptively time-consuming and expensive process—and getting the charting components built is only part of the project. You’ll still need to consider a lot more before you can deliver the dream analytics experience for your users or customers. This includes caching, row-level security, localization, data modeling, filtering, and end-user interactions to name a few.
That’s why we built Embeddable: For you to focus on the things you want to build while we handle all of the things you don’t want to worry about for you.
Explore Embeddable's open-source component library, full of charts that are instantly usable in your Embeddable project, or anywhere else.
How Embeddable can help you build charts and graphs in 10% of the time
The beauty of charting libraries is that you get to build charts in just the way you want them, without spending hours and hours of development time re-coding the wheel. But building the components yourself is just the start. You’ll also need to consider secure and performant data presentation, interactions between on-page elements, and caching. As well as setting up row-level security, thinking of localization (i.e. using the right time zones, currencies, and measuring units), and more to deliver a truly remarkable analytics experience in your application or website.
That’s where Embeddable comes in.
Embeddable is a next-gen SDK for building fast, interactive, and fully custom analytics experiences into your apps and web pages—and because it's fully headless, it's compatible with any charting library. Its frontend toolkit is combined with a backed engine that connects to your data sources using a secure, read-only transaction. You’ll define the data models in SQL and get full control over your components, which are all stored in your code repo.
Then, anyone on the team can customize the user-facing analytics experience using our intuitive no-code builder. So, if your manager wants to tweak the dashboard, they can do it all without your help and publish changes in seconds.
Check out how to build with Embeddable: Read developer docs
And find out how companies who already use Embeddable are getting on : Explore customer stories
Frequently asked questions about choosing a charting library
What are the charting libraries for JavaScript?
There are over 30 charting libraries available for JavaScript, including:
- D3.js
- ECharts
- Chart.js
- Highcharts
- Recharts
- ApexCharts
- Cytoscape.js
- Plotly
- Chartist.js
- C3.js
- Tremor
- amCharts
- FusionCharts
- AnyChart
- AG Charts
- Google Charts
- Material UI
What’s the simplest JavaScript chart library?
Tremor is one of the simplest JavaScript chart libraries. It’s super lightweight and, as a result, its charting options are pretty basic. However, Tremor is designed for users who want to create straightforward charts quickly, so it’s ideal for simple use cases like internal dashboards or presentations. If you want more customization than Tremor can offer, Highcharts and ApexCharts are both easy-to-use alternatives.
What’s the best JavaScript library?
Depending on your requirements, the best JavaScript library is D3.js, as it’s by far the most customizable. However, it’s also really complex and difficult to master. Plus, it’s not as compatible with TypeScript as it is with JavaScript, which can be off-putting for some developers. If you’d prefer a less complex library that you can use with TypeScript, ECharts, and Highcharts are strong contenders, both with a wide range of chart types available.
References
- Apache ECharts - Get Started (installation & usage): https://echarts.apache.org/handbook/en/get-started/
- Apache ECharts Handbook - Canvas vs. SVG (renderer guidance): https://apache.github.io/echarts-handbook/en/best-practices/canvas-vs-svg/
- Chart.js - Getting Started → Usage: https://www.chartjs.org/docs/latest/getting-started/usage.html
- Chart.js - Responsive Charts: https://www.chartjs.org/docs/latest/configuration/responsive.html
- Highcharts - Buy Highcharts License (pricing overview): https://shop.highcharts.com/
- Highcharts - Getting Started with 3D Charts: https://highcharts.com/docs/chart-concepts/3d-charts
- Recharts - Official Site & Docs: https://recharts.org/
- ApexCharts - Installation & Docs: https://www.apexcharts.com/docs/installation/
- D3.js - What is D3?: https://d3js.org/what-is-d3
- G2 - Chart.js Reviews: https://www.g2.com/products/chart-js/reviews
- G2 - Highcharts Reviews: https://www.g2.com/products/highcharts/reviews