Sigma for Embedded Analytics: 4 Top Alternatives Listed
Sigma is one of the most popular BI platforms in the market. But it still falls short when embedding those analytics into external apps—mostly because it embeds through an iframe. If you want to serve your customers with remarkable user-facing analytics, try out one of these four suitable Sigma alternatives.
Summarize with:
Sigma Computing might have a strong solution for internal business intelligence (BI), but many companies express frustration with its suitability when it comes to embedding analytics into customer-facing applications.
Since Sigma embeds through an iframe, you can use it to share data with your users fast, but you don’t have much control over the design and it won’t feel like it’s really part of your application. iframes also tend to be slow and clunky, and don’t allow for bi-directional communication between your app and the analytics.
Since you’re here, it’s likely you’re currently using Sigma for embedded analytics (or considering it). But you’re not sold on it being the right tool for your needs. We’ll explore the most common reasons people look for Sigma alternatives for embedded analytics and help you find a more suitable solution.
We’ve compiled four alternative solutions along with their pros, cons, pricing, and differences to Sigma. We’ll also take a brief look at custom-built embedded analytics, so you’ll have everything you need to make a decision.
Discover a developer-friendly toolkit that’s purpose-built for creating remarkable customer-facing analytics in a fraction of the time. Learn more
Sigma Embedded Analytics
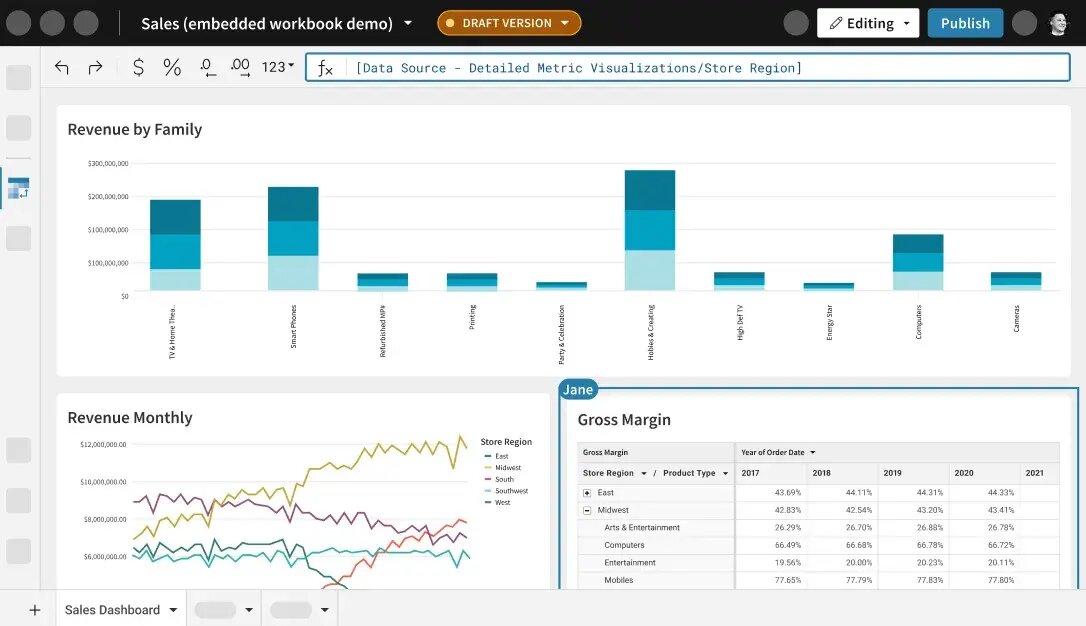
Sigma Computing is a no-code cloud-based analytics platform for self-service ad hoc queries. It connects to multiple data warehouses, including Snowflake, BigQuery, Redshift, PostgreSQL, and MySQL.
With Sigma, you can use an iframe to embed dashboards or reports to websites and applications. It provides off-the-shelf charting components for creating line charts, bar charts etc. without any coding. The problem is you can’t then edit these components in code. Many teams quickly find themselves limited in what they can build.
Since it has a cloud-based architecture, Sigma can scale up or down as needed to adapt to your business needs (if your wallet is big enough). Overall, it’s a mature tool with a shallow learning curve and some customization freedom. But maybe it’s not right for you.
Why you might look for an alternative to Sigma for embedded analytics
While Sigma is a popular BI platform, it does have some limitations as an embedded analytics solution. We kept these weaknesses in mind as we searched for great alternatives:
-
Embeds through an iframe. This can be a blessing and a curse. Adding an iframe URL to your app is an easy way to securely embed analytics into your app and serve your customers fast. However, iframes take away control and often make your analytics experience feel clunky and foreign to the rest of the app. Embedding through web components or an SDK might be a better alternative if you want a native feeling.
-
Lacks full customization freedom. There are only a few things you can edit in terms of design. So, while you can quickly whip together charts and dashboards, it’ll always look like Sigma, not necessarily like your brand or design system. If you can’t get full customization freedom, you may want to find a tool with a larger, more configurable visualization library or a headless tool that lets you use your own charts.
-
Can be costly. Sigma doesn’t disclose prices online because it operates on a quote-based model. However, some customers say it costs around a thousand dollars per year for each creator. For big businesses, that could add up to $25,000-$35,000 a year. So, while it doesn’t charge per view, you’ll likely need to pay for more users as you grow. Ideally, you may want to find a tool that charges a fixed price.
-
Has an opinionated UI. While Sigma’s UI is easy to use, the trade-off is less control over the UX/UI. You’re given a menu of predefined charting components, but you can’t edit these as you would if they were in your own code repo. This makes it harder for creators to make their analytics experiences unique. It's frustrating but a common issue with most embedded analytics tools. Some of the alternatives below will allow you full control over the code so you can craft the analytics experience that you really want.
“I think Sigma's dashboarding has room for improvement. They have a relatively limited number of visuals that you can use, and sometimes, I need visualizations that are outside of their offering.” — Erik Jones, Head of BI and Analytics at HyperScience.
Sigma alternatives at a glance
For this article, we investigated two BI platforms with decent embedded analytics products. We’ll also cover Explo, a purpose-built embedded analytics platform, and Embeddable, our very own embedded analytics toolkit.
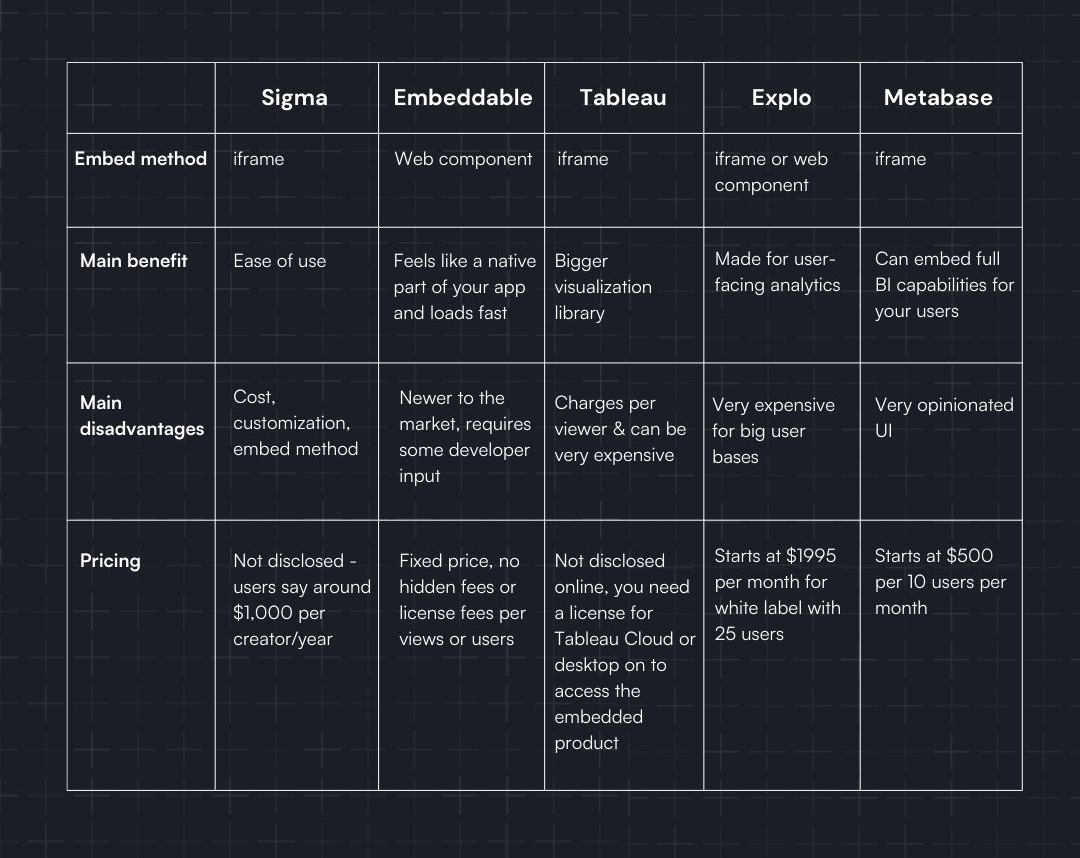
Let’s look into these options in more detail:
1. Embeddable
Embeddable is a software development kit (SDK) for building remarkable, highly custom user-facing analytics. It uses a headless approach, allowing you to combine data models and charting components that your engineering team can redefine or tweak in code. These definitions pass on to the no-code builder that your customer-facing teams can access to build engaging, interactive dashboards that fit perfectly with your existing user experience.
With Embeddable, you’ll get a:
- Front-end toolkit. Pull the charts provided into your git repo, make any edits you like, and push them to Embeddable using the SDK. It’s pure code, so you can also use any open-source charting library you like (e.g. ChartJS, Highcharts, Google Charts, Tremor) or even build your own.
- Backend engine. Embeddable manages security, performance, caching, and infrastructure requirements — while providing the end user with real-time data that loads instantly. It connects to all major databases securely through a read-only transaction and lets you customize the cache for even better performance.
- No-code builder. Anyone on your design, product, or customer success teams can design and iterate upon your dashboards without having to write a single line of code. Instead, they use an intuitive point-and-click interface and build experiences that align with your brand.
- Self-serve dashboard building power for your end users with Custom Canvas: a flexible way for your customers to assemble their own dashboards using charts and components that match your design system exactly.
Embeddable was built on hundreds of conversations with customers of our BI tool, Trevor.io. We know how complex it is to come up with great analytics experiences from scratch. It’s time-consuming, expensive, and overwhelming for a team of developers that’s already spread thin. But going with a plug-and-play solution never offers enough flexibility to deliver remarkable analytics experiences to your customers.
When you use Embeddable, unlike with other SaaS products, you also become part of a community of developers, designers, and engineers. You’ll innovate and experiment together to provide game-changing, fully bespoke user-facing analytics.
Curious to learn more? Read the developer docs
What users say about Embeddable
Users like Embeddable because it helps them create impressive, native analytics experiences with live data—in 10% of the time it would take them to build them from scratch.
"What really excited me about Embeddable was what comes after [embedding analytics]. We're talking about building filters, letting our users manage the charts themselves, and letting the team beyond just me make changes. That's where it starts to get really lucrative." — Nick Larson, Co-founder and CTO at AnyCreek.
Embeddable pricing
We work on a fixed embedded analytics pricing model. This means you pay a fixed price for unlimited use, no hidden costs or extra fees per users or viewers. This makes Embeddable a highly affordable solution for mid to large businesses, or products with a large or growing user base.
Embeddable vs. Sigma
The main differences between Embeddable and Sigma are:
- Sigma is essentially a BI tool with embedding capabilities, which means you can add your dashboards or reports to your apps using an iframe. Embeddable uses a web component, which enables you to achieve a faster-loading, native-feeling experience.
- Embeddable is an SDK toolkit that simplifies the development of customer-facing analytics while giving you the control to provide end users with fully bespoke experiences.
- Sigma limits customization, hence dashboards always look like they were made on Sigma, whereas Embeddable gives you full customization freedom.
2. Tableau
Tableau, a Salesforce product, is another popular BI analytics platform. Users love it because it can process very complex data and turn it into attractive designs—Tableau has a big visualization library.
Tableau connects to multiple databases and cloud-based data warehouses, including Oracle, RedShift, MySQL, and Microsoft SQL Server. Amongst Tableau’s benefits, you can find the ability to create custom calculations and do transformation tasks for more insightful self-service analytics.
This tool is also thought out to be collaborative, so it’s very easy for teams to share and work together on the same dashboard. Tableau lets you embed your complex visualizations into your internal and external apps through an API. This embedding technique gives you a bit more control over your analytics experience than an iframe, but still has its limitations.
What users say about Tableau
While Tableau is known for simplifying complex information and having multiple visualization forms, users think it still lacks customization. Plus, it can have a steep learning curve for non techies.
“Tableau is a bit tricky when it comes to working with date and time functions. Some specific charts aren’t available and you can’t write SQL queries directly into Tableau, which makes it impossible to make statistical analysis. It’s sometimes difficult to operate and navigate through calculated fields.” — Anonymous Tableau user on Capterra.
Tableau pricing
Pricing for Tableau embedded analytics is only available through a quote. However, we know it charges per different types of users and viewers for the cloud and desktop version. This suggests the pricing model for the embedded analytics products follows the same logic. Charging per viewer can make this an expensive product for user-facing analytics.
Additionally, you need to have a license for Tableau Cloud or Desktop before accessing the embedded product. This means you need to pay for:
- Creators—$75/user/month
- Explorers—$42/user/month
- Viewers—$15/user/month
Tableau vs. Sigma
Tableau and Sigma are very similar options as they were both built for business analytics and then repurposed for customer-facing analytics. However, there are a couple of differences between them:
- Sigma is easier to use and more affordable than Tableau as it doesn’t charge a fee per viewer.
- Tableau, on the other hand, can process more complex data and come up with more detailed visualizations.
- Sigma embeds using an iframe, while Tableau uses an embedding API.
3. Explo
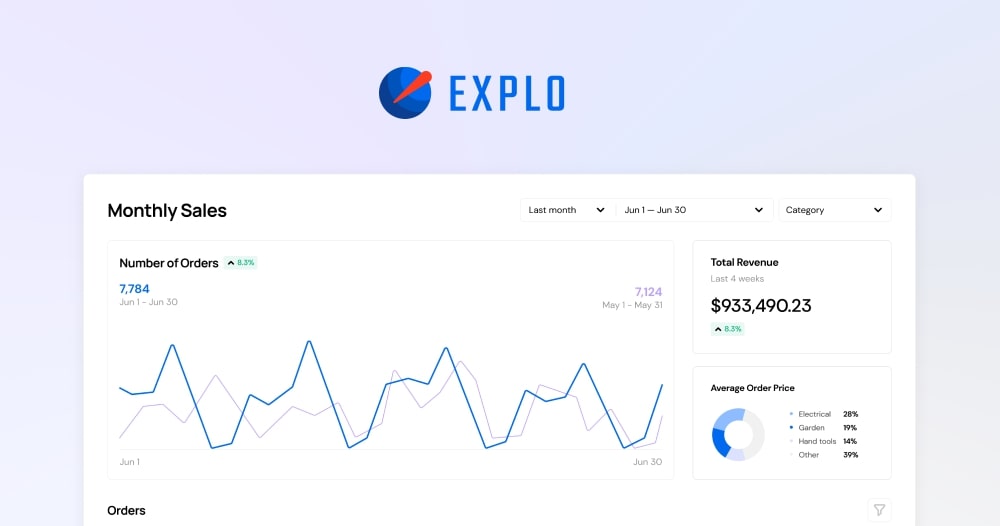
Explo is a purpose-built embedded analytics platform. So, unlike Tableau, Looker, Power BI, Sigma, and all of the popular BI tools, it was created to serve your end-users (rather than your internal business users).
As a result, it has a better notion of the kinds of designs that customers want to see in an app—you could say it’s more modern and less corporate. It also lets users configure and download reports on top of seeing data in dashboards.
The downside to Explo is that it can be really expensive, especially because it charges per viewer. Additionally, while Explo’s graphs are interesting and eye-catching, they can’t be fully customized and you don’t have complete control over the styling—or performance as it embeds through an iframe or web component.
What users say about Explo
Users like that Explo is easy to use and designed with the end user in mind. However, the pricing can be aggressive for businesses with a big user-base.
“[Explo’s] pricing model got really weird for me. They were targeting smaller customers and the way they structured their pricing would bankrupt any big company.” — Justin Hayes, CEO of a shipping analytics company.
Explo pricing
Explo prices start at $695 per month for 25 ‘customer groups’ but retains the Explo branding. In Explo’s Pro (starting at $1,995/month) and Enterprise plans, users get access to unlimited embedded dashboard templates and data schemas, and fully white-labeled dashboards and reports.
However, since Explo charges per user and features, you can easily end up paying as much as with a classic BI tool with an embedding feature (but without accessing internal BI features).
Explo vs Sigma
Here are the differences between Sigma and Explo:
- These tools were ultimately built for different purposes. Sigma is BI analytics tool with embedding capabilities, while Explo lets teams create embedded analytics for end users.
- Sigma embeds primarily through an iframe, while Explo supports both iframe and web component embedding.
4. Metabase
Metabase is a good low-code business intelligence platform for business users with a high number of ad hoc queries. It can process very complex data through SQL scripts and interactive visualizations.
Its embedded analytics product allows you to set up static or interactive dashboards and bring them into your app using an iframe. Metabase Embedded also lets you add drill-downs, drill-throughs, and other forms of interactivity for your users to explore the data as they need.
Essentially, end users get the full BI tool within your application—which can pass on a learning curve to them. It’s hard to process complex data and get actionable insights and the visualizations are a bit lacking. At a basic level, though, Metabase is user-friendly and can be more cost-efficient than other BI solutions (depending on your needs).
What users say about Metabase
Users like Metabase because it offers on-premise and cloud-hosted solutions and because it’s easy to use for simple dashboards. However, they could benefit from more customizable visuals and some users report slow-loading speeds.
“Metabase's data visualization features are a step or two below the top competitors on the market. In addition, using more complex datasets and functions will slow down and cut into the reliability of the tool.” — Jared C., Business Data Analyst and Metabase user.
Metabase pricing
This BI tool offers different pricing options for its cloud- or self-hosted versions. In both cases, interactive embedding capabilities are only available for Pro or Enterprise users, which start at $500 for 10 users per month. Any additional user is $10 per month.
Metabase vs Sigma
The biggest differences between Sigma and Metabase include:
- Sigma is fully cloud-hosted while Metabase can be also hosted on-premise.
- Metabase is more affordable than Sigma according to online user comments.
- Sigma seems to be easier to set up and use for data analytics but can pass on complexity to your end users, especially if using interactive embedding.
- Sigma and Metabase both embed using an iframe.
What about custom-built embedded analytics?
Right now, all the best examples of user-facing analytics are custom-built. Using your existing BI tool could never achieve the same standard as a large in-house team developing the front and back end. But that takes stacks of time and a large budget.
Building analytics from scratch is costly and time-consuming, especially if you want features like chart interactivity, localization, and the ability for your customers to build their own dashboards. This is exactly why we built Embeddable. We don’t believe you should have to sacrifice customizability for the sake of cost and easy implementation.
Embeddable uses a headless approach, doing all the backend work for you whilst you have full control over the frontend UX and UI. It’s much less complex than developing in-house and gives your team the tools to create highly interactive user analytics experiences that blend right in with your website or application.
Which embedded analytics solution to choose
So, if you’re not convinced by Sigma. Here’s what we recommend instead:
Try Metabase if you want read-only, high-level analytics. You can create static analytics and share them with your users with any plan, so it can be quite cost-efficient.
Go for Tableau if you want to show complex calculations and data analysis first without many design requirements. This tool is known for processing complex calculations and supporting multiple data sources with an ok design.
But if you want to achieve a native-feeling experience, then Embeddable is the only real option. With Embeddable, you get a front-end toolkit, a no-code builder, and a back-end engine to design the analytics experience that you desire for your customers. Plus, it’s accessible at a fixed price, so you won’t have to worry about paying more if you grow your business users or viewers.
Discover a developer-friendly toolkit that’s purpose-built for creating remarkable customer-facing analytics in a fraction of the time. Learn more
Frequently asked questions about Sigma alternatives for embedded analytics
How do you embed Sigma?
Sigma embeds using an iframe, this means you copy and paste a code snippet into your repo. While it’s extremely easy to set up, this makes analytics experiences feel foreign, clunky, and sometimes slow to load.
How is Sigma different from Tableau?
Sigma and Tableau aren’t that different from each other as they’re both BI analytics platforms with embedding capabilities. However, some slight differences include:
- Learning curve: Sigma is easier to use than Tableau for non-technical users
- Pricing: Sigma is more affordable than Tableau and it also doesn’t charge per viewer
- Embedding options: Sigma uses an iframe while Tableau also embeds through an API