
Fully interactive dashboards
defined in code
Define dashboards directly in your codebase. Version-controlled, agent-ready, deployed through your existing release process, fully governed and secure
In your codebase
Native in your product
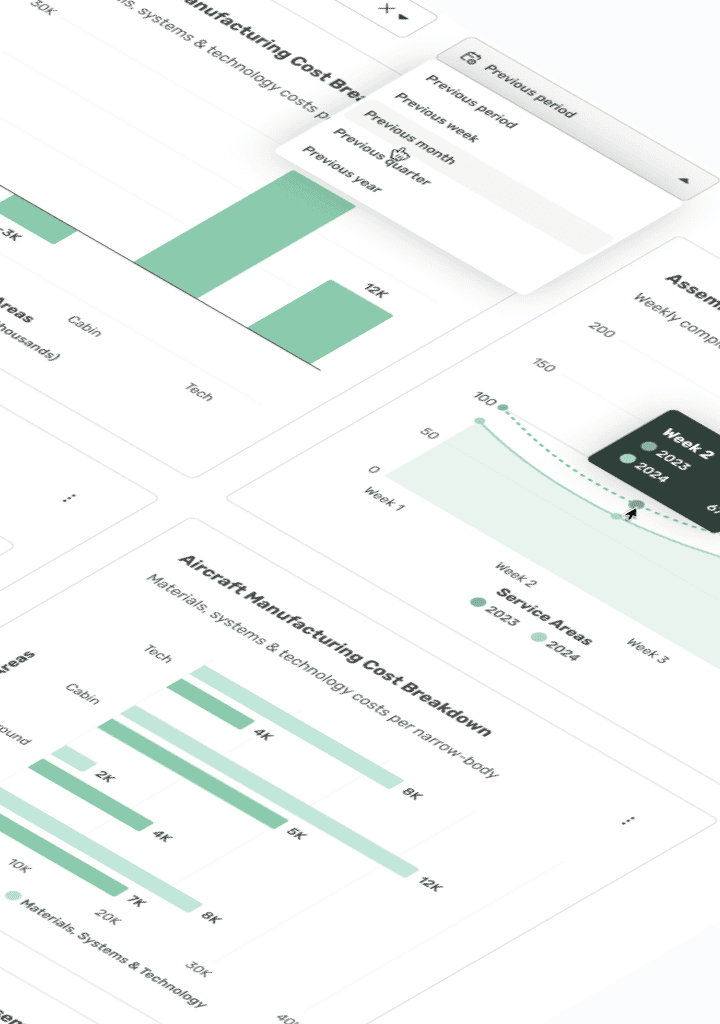
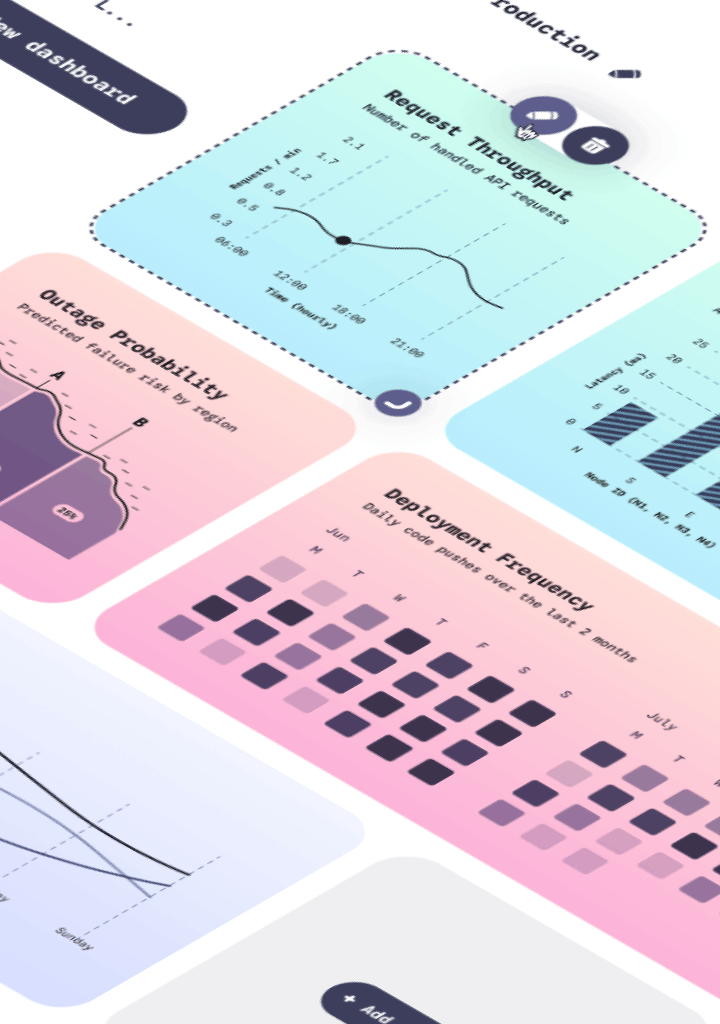
A single source of truth in your repo
Dashboards your team can review, version, and ship like any other part of your app

Git-native workflow
Dashboards live alongside your models and components. Full history, branches, PR reviews. No drift between code and configuration.

Built for agentic flows
Iterate from your terminal with Claude Code, Cursor, or Codex. YAML is LLM-friendly by design - the whole dashboard is one file an agent can reason about.

Live preview, instant feedback
Edits to
.embeddable.ymlhot-reload inembeddable:dev. No page refresh, no rebuild.
No-code builder optional
Define, iterate, and deploy entirely in code. Use the builder when you want to - never required.

Duplicate in seconds
Copy a YAML block to spin up a new dashboard or variant. Stamp out ten as easily as one
How it works
From file to deployed dashboard, inside the workflow you already use
- Embedded dashboardsNative in your productSelf-serve reportingUsers answer their own questionsAI insights & chatAsk anything, in plain languageOne governed, scalable, code-based foundation
What you get
AI-powered data experiences your users will love, in 10% of the time. Here's how it fits together.
- your-repo/
- components
- datatable.tsx
- kpichart.tsx
- linechart.tsx
- data-models
- accounts.yml
- usage.yml
- transactions.yml
- dashboards
- executive-overview.yml
- sales-performance.yml
- usage-analytics.yml
A code-first foundation
Data models and components live in your own repo - version-controlled, reviewed, and pushed to Embeddable via the SDK.
- your-repo/
- components
- datatable.tsx
- kpichart.tsx
- linechart.tsx
- data-models
- accounts.yml
- usage.yml
- transactions.yml
- dashboards
- executive-overview.yml
- sales-performance.yml
- usage-analytics.yml
A world-class component library
Open source and fully extensible. Use ours, customize, or write your own - by hand or with an agent.
 + 30 more · all open source, all in your repo
 - your-repo/
- components
- datatable.tsx
- kpichart.tsx
- linechart.tsx
- data-models
- accounts.yml
- usage.yml
- transactions.yml
- dashboards
- executive-overview.yml
- sales-performance.yml
- usage-analytics.yml
A governed semantic layer
Cube-based data models govern access and define each metric once - so every dashboard and chat answer agrees.
accounts.ymlcubes: - name: accounts measures: - name: revenue type: sum dimensions: - name: tier type: string
8 dashboardsAI chatRLS - your-repo/
- components
- datatable.tsx
- kpichart.tsx
- linechart.tsx
- data-models
- accounts.yml
- usage.yml
- transactions.yml
- dashboards
- executive-overview.yml
- sales-performance.yml
- usage-analytics.yml
Trusted, scalable data experiences
Models and components combine into the experiences your users see - dashboards and AI chat built from the same governed foundation.
- your-repo/
- components
- datatable.tsx
- kpichart.tsx
- linechart.tsx
- data-models
- accounts.yml
- usage.yml
- transactions.yml
- dashboards
- executive-overview.yml
- sales-performance.yml
- usage-analytics.yml
Self-serve dashboards
Native, interactive dashboards - drilldown, filters, and self-serve included - built in code, our no-code builder, or via an agent.
executive-overview.ymlname: Executive overview models: [accounts, transactions] components: - kpichart: value: accounts.revenue - linechart: data: transactions
- Why did revenue dip in March?
Two enterprise renewals slipped to April. Usage held steady, so April recovers the gap.
accounts.ymlRLS enforcedAI chat, grounded in your data
Users ask in plain language and get answers as text or live charts, without leaving your product. Grounded in your semantic layer, respecting row-level security. Bring your own LLM.
Native embedding in one tag
One web component drops into any app - React, Vue, plain HTML. Native, not an iframe. Server-side tokens scope every view to the signed-in user.
- Multi-tenant secureRow-level securityFast at scaleMulti-tier cachingFully auditedEvery query loggedControlled self-serveWithin your guardrailsVersioned & reviewedEverything in gitSOC 2 Type IIEnterprise-grade
Production-ready from day one
Multi- and single-tenant secure, fully audited, SOC 2 Type II. We handle the hard infrastructure so you can focus on the experience.
Deployment Flow
Build, Test, Deploy
1. Define in code
Add a YAML file anywhere in your repo. Each entry defines one dashboard - data, charts, filters, interactions, and more.
flight-performance.embeddable.yml
embeddables:
- name: flight-performance
title: Flight Performance
datasets:
- name: orders
model: flights
widgets:
- component: BarChart
inputs:
- input: metric
value: flights.frequency
- input: dim
value: flights.region
2. Preview in dev-mode
Run `embeddable dev`to test your dashboards. Iterate directly or with Claude Code or other LLMs. Hot-reload as you edit.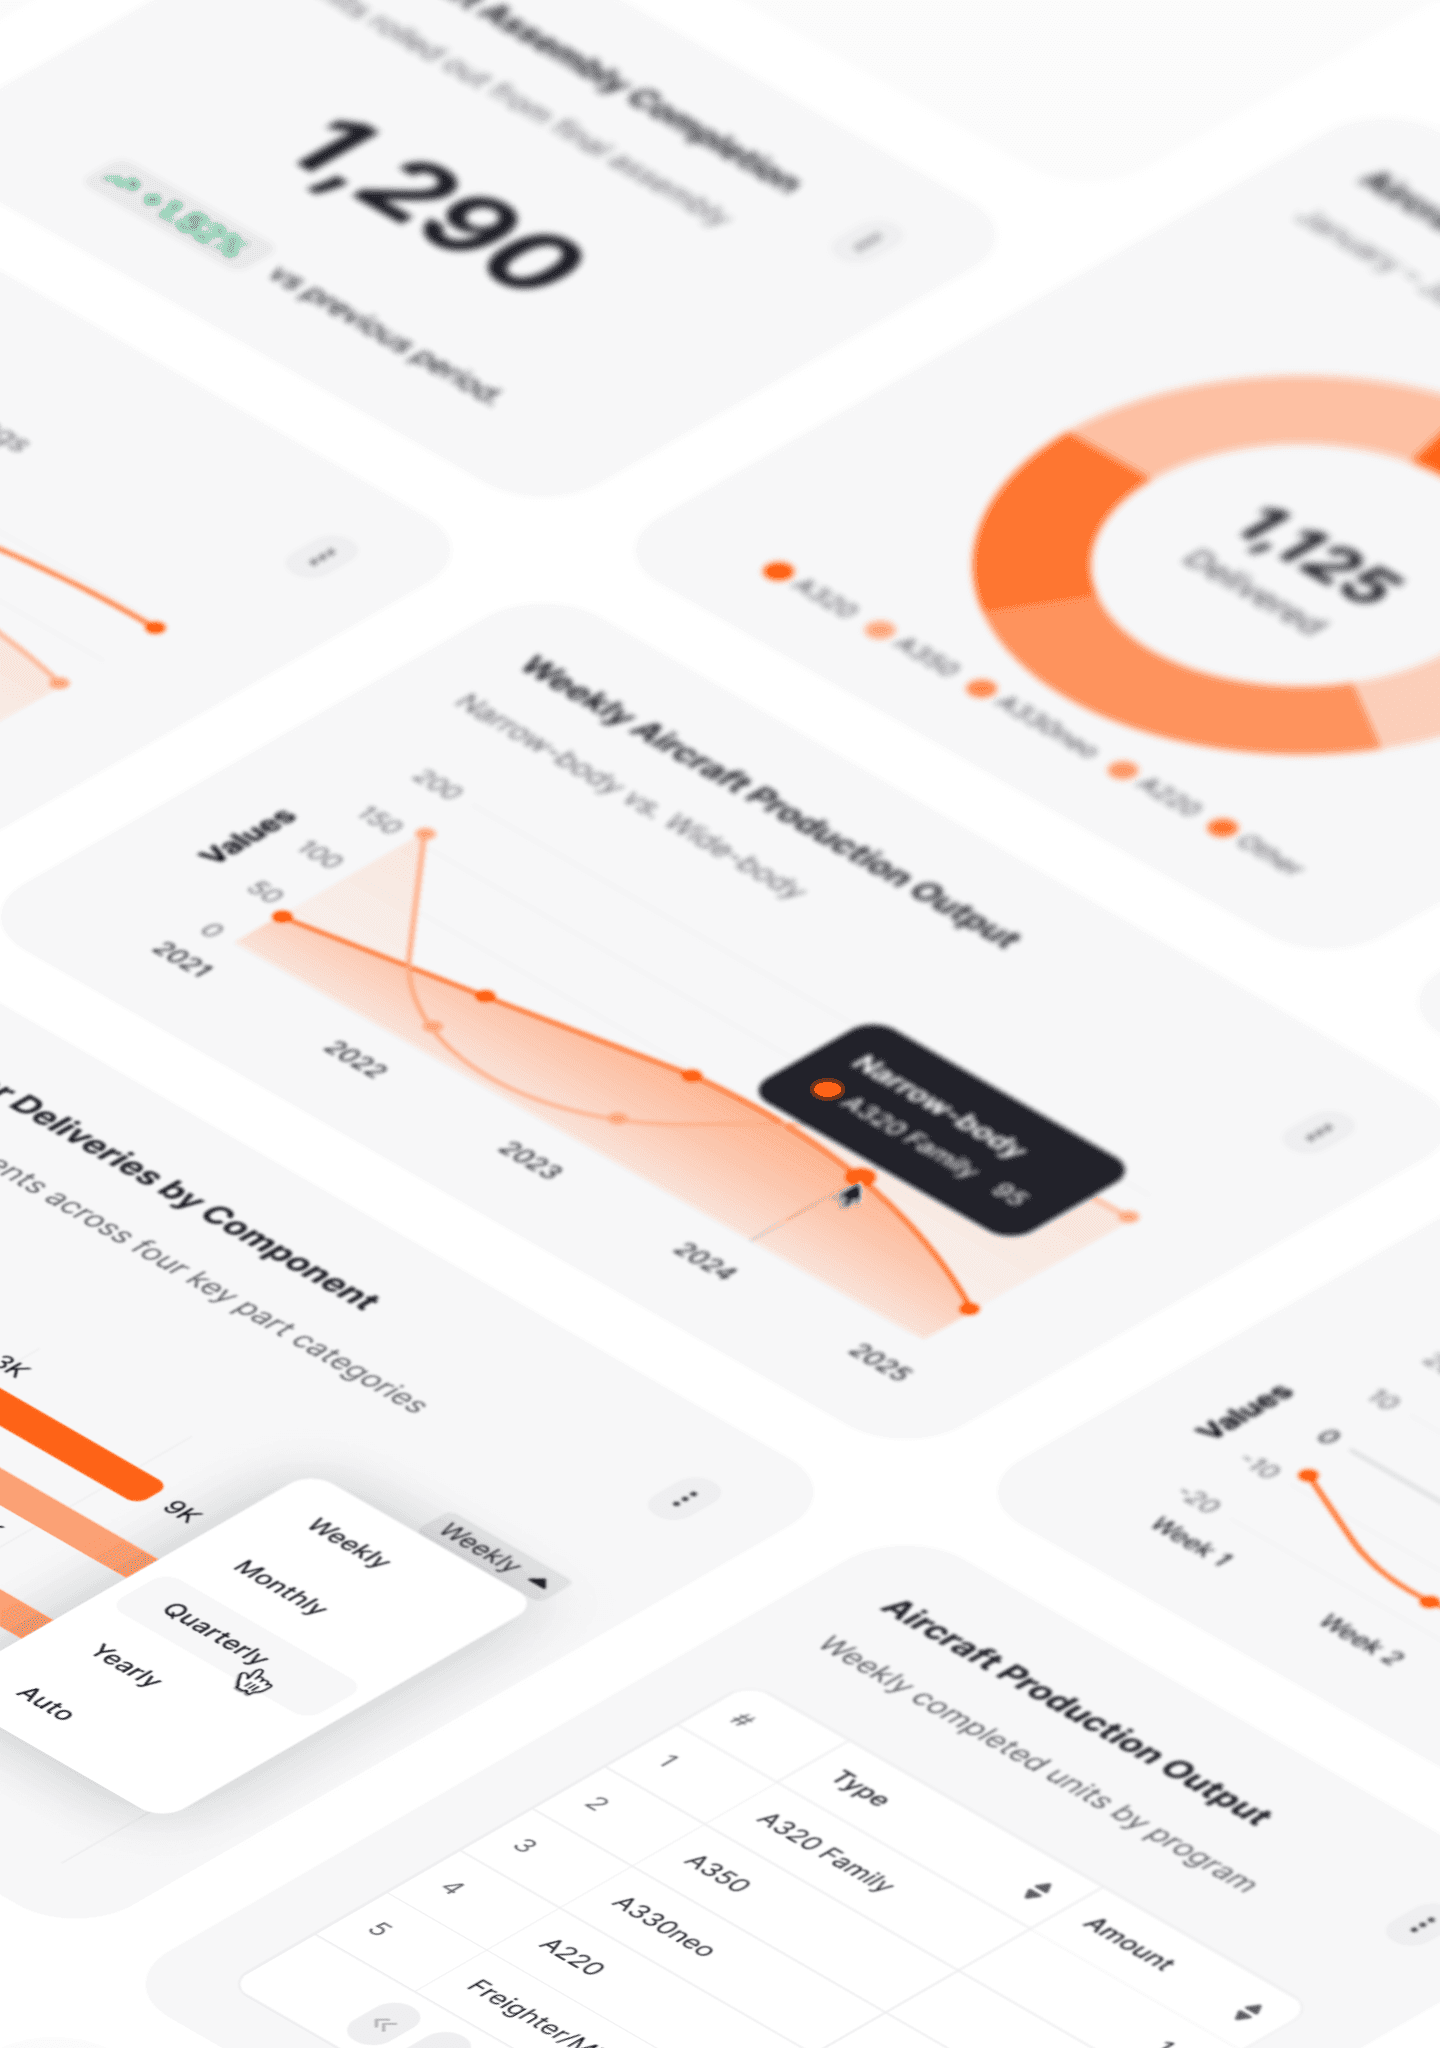
3. Push to deploy
Run `embeddable push`to create an immutable saved version. Embed in your platform via a web component (no iFrames). Learn more.~/acme-product › embeddable deploy
✔ Data models validated
✔ Components validated
✔ Dashboards validated
✔ Validation completed. No issues found.
deploy finished in 3.78 s
publish finished in 0.78 s
✔ Published v2.4.1
Full-fidelity dashboards, expressed as YAML
Interactive, on-brand dashboards with self-serve enabled. All defined in code.

Content
Define the building blocks of your dashboard - datasets, components, and layout - all in one file
Interactions
Wire up the behaviour that makes dashboards feel alive — variables, filters, events, and drilldowns
Self-serve
Configure what your end-users can extend or build themselves - Custom Canvas, fully defined in code
Built for agentic development workflows
More teams now use AI tools to scaffold dashboards, models, and UI faster. Embeddable is built for that reality: code stays in your repo, the integration path is programmatic, and the trust layer underneath handles permissions, auditability, and scale.
 Code stays in your repo
 CLI-first workflow
 Permissions and auditability built in
 Ask us