Native customer-facing analytics built into your product
Embeddable gives software teams the infrastructure, semantic layer, and developer workflow to ship customer-facing analytics that look native, load fast, and stay governed as they scale.
Use Embeddable to build embedded dashboards, self-serve analytics, reports, and AI-powered insights on top of the same trusted foundation.
Build analytics your customers will actually use
Embeddable gives you the building blocks to ship analytics experiences without building the entire stack yourself

Native to your product
Build dashboards, reports, and AI-powered analytics that match your design system, frontend, and user experience - not a bolted-on BI iframe.

Governed by default
Centralise metrics, dimensions, joins, permissions, and customer access rules in a semantic layer, so every experience uses the same trusted definitions.

Built to scale
Launch faster without building the whole analytics stack yourself, then keep extending it with code-first components, controlled releases, caching, and secure embedding.
One platform for every customer-facing data experience
Start with dashboards. Add self-serve exploration. Bring AI into the experience. Every workflow runs on the same governed foundation, so your teams do not need separate tools, models, or permission logic for each use case.
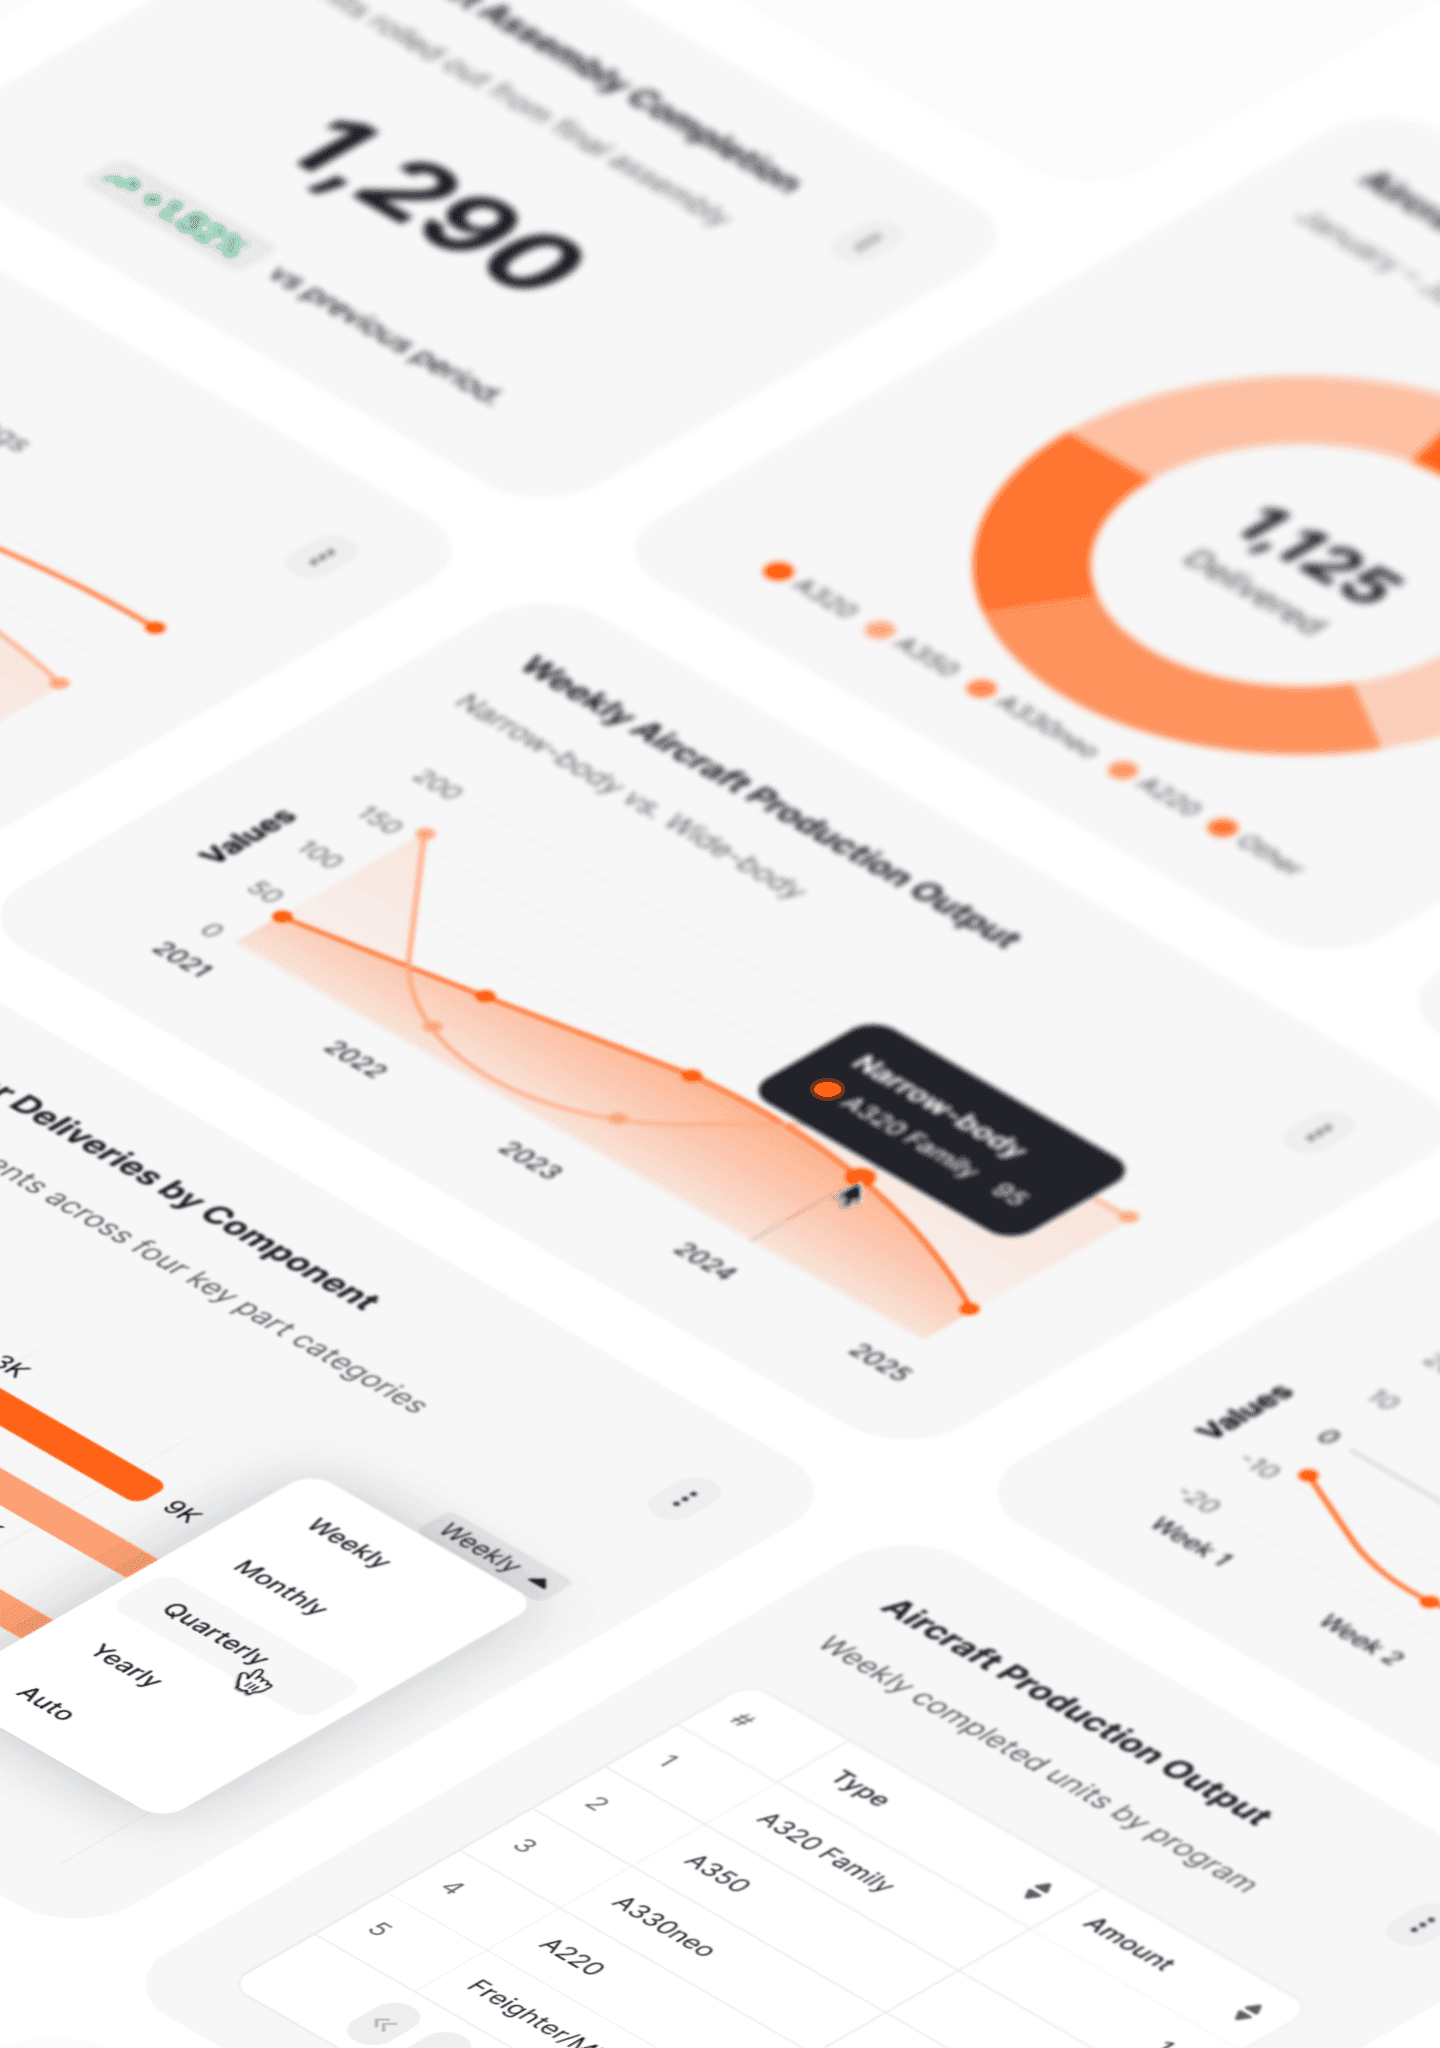
Embedded dashboards
Give customers fast, interactive dashboards inside your product, built with your components, your design system, and your data model.
Self-serve analytics
Let users explore, filter, customise, and answer their own data questions safely, without exposing raw data or creating one-off reporting workflows.
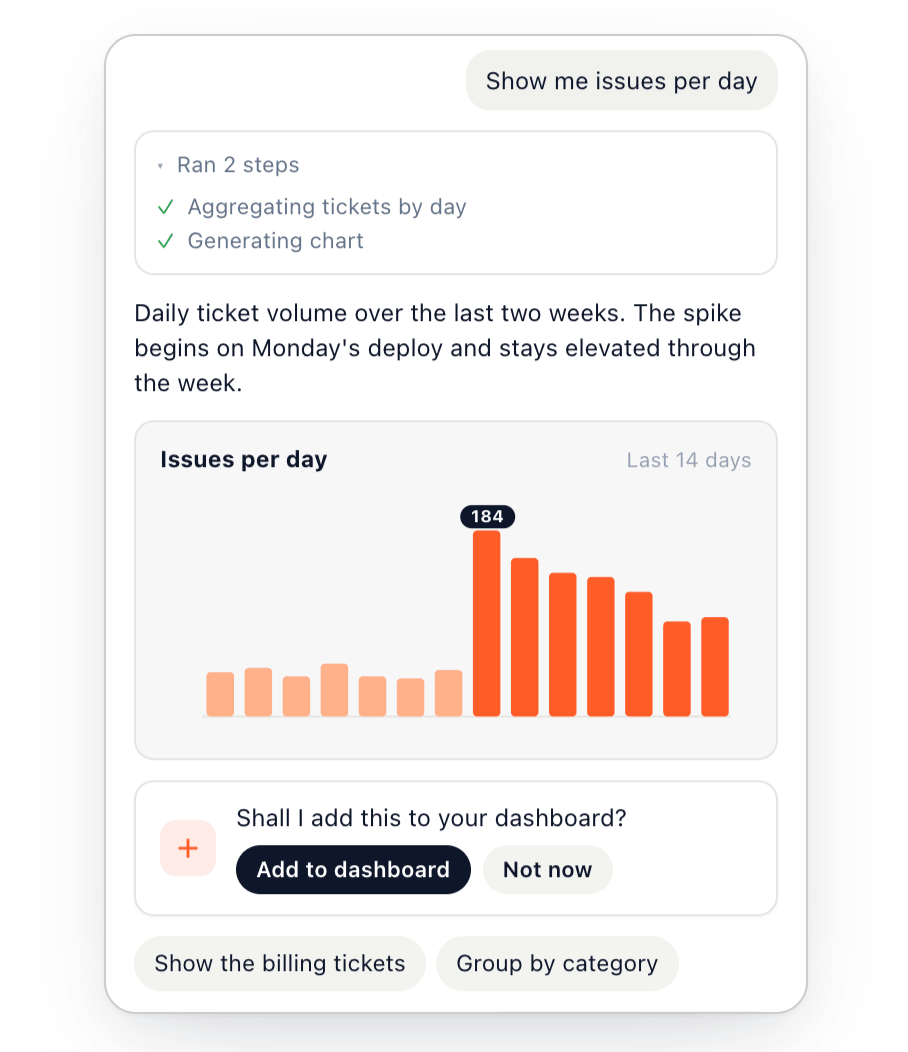
AI-powered insights
Build AI analytics experiences on top of governed metrics, permissions, and customer context, so answers are grounded in the same trusted model as your dashboards.
How Embeddable fits together
Embeddable draws a clean line between the parts your product should own and the infrastructure you shouldn't have to rebuild. You control the experience; we run the layer beneath it.
 Learn more
World-class components
Every customer-facing element is yours to control - how each component looks, behaves, and fits your product. Analytics that feel native, not bolted on.
 Learn more
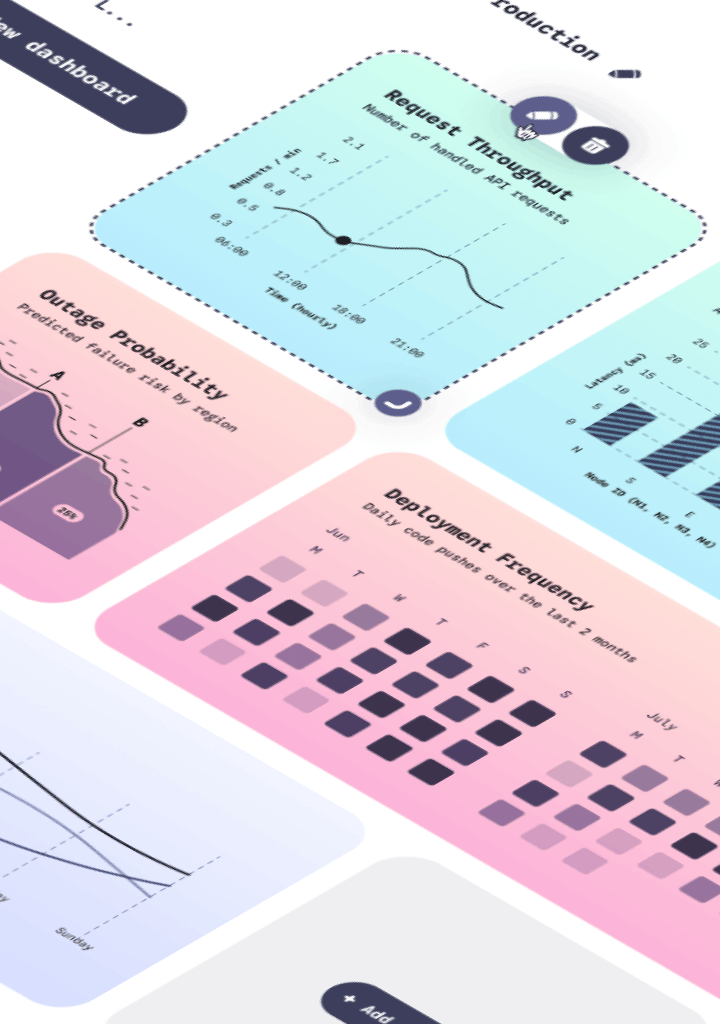
Dashboards as code
Define components, data models, themes, and access policies in code. Everything version-controlled, reviewable, and in your repo.
 Learn more
Governed self-serve
Let customers build and explore their own dashboards - safely, within the bounds you've defined. Powerful and flexible, but safe.
Connect to your database
Connect directly to your database, over SSL or SSH. Embeddable never copies your data - data models define exactly what can be queried and by whom.
 PostgreSQL
 MySQL
MySQL Snowflake
 SQL Server
 Clickhouse
 Redshift
 BigQuery
Embed in any front-end
Drop a full dashboard - or a single chart - into any app, framework, or platform using simple, interactive HTML web components.
 React
React Vue
Vue Angular
 Next JS
 Javascript