.jpg)


Looker is a popular business intelligence (BI) platform among teams that depend on Google Workspace. One of the things that makes it attractive to data scientists is LookML, the solution’s source-controlled semantic layer.
However, Looker is very, very expensive, and the bill goes up further once you need Looker embedded analytics for external users. We’ll get into detail below, but essentially, Looker offers three embedding options for internal and external use. Two of them—signed and private embedding—still require a licensed account for every viewer, and that's billed per person.
There are certainly better options for your wallet (and overall UX). Perhaps that’s why you’re in the market for an alternative to Looker Embedded. In this article, we’ll cover the pros and cons of Looker Embedded together. Then, we’ll explore some of the best alternatives available to help you find the best tool on the market and add the most value to your end user.
NOTE: This article is about Looker Embedded, not Looker Studio (formerly Google Data Studio) or Looker BI.
Discover a developer-friendly toolkit that’s purpose-built for creating remarkable customer-facing analytics in a fraction of the time. Learn more
Looker Embedded

Looker Embedded is part of Google Cloud and is one of three Looker platform editions (alongside Standard and Enterprise), purpose-built for deploying analytics to external, customer-facing users. It offers three embedding options (all through an iframe):
- Signed embedding. You share your Looks or dashboard to your website and users that log into your system are already authorized to view the data.
- Private embedding. You share your Looks or dashboard with external users. They need to log in to view the data, either with a Looker account, Google OAuth, or another identity provider via OpenID Connect.
- Public embedding. You share Looks (not dashboards) on websites, apps, or public pages.
While Looker embeds through an iframe, it’s not quite the same as other BI tools with embedded capabilities. Most of these tools slap your dashboards or reports straight into your app (somewhat sluggishly, thanks to iframe embedding).
Instead, Looker provides users with access to a portal. Here, they can see the data you make available, but they can also bring in and analyze their own data. It’s a bit like providing a data infrastructure that they can customize. It sounds cool, but it has drawbacks, as we’ll explore below.
Battle of the BI: Discover the differences between Looker Embedded vs Power BI Embedded.
Why you might look for an alternative to Looker Embedded
Looker’s analytics are high-quality, but generally not suited to startups or smaller businesses, thanks to the price tag. One user we interviewed was given a quote of $120k a year as a starting point for their use case.
Here’s a round-up of the main limitations of Looker Embedded:
- Embedding costs a small fortune. On top of the bill you’re already paying for Looker BI, you pay for each external user that views your dashboards—and even removing the “Powered by Looker” branding is a separate paid add-on, not something included by default. “Looker is crazy expensive for a beginner, and I’ve found that some of the tools feel limited” says Vikas K., a user who reviewed Looker on G2.
- The UX isn’t great. Looker embeds through an iframe, which means your analytics are in an inflexible rectangular box and experiences can be clunky and slow to load. Plus, if you use private embedding rather than signed embedding, your customers need their own login credentials (a Looker account or an SSO provider) just to view the data—adding another layer of complexity to customer-facing deployments.
- There’s a steep learning curve to full utilization. Looker itself has a real ramp-up curve. Even if you’re a Looker Studio user, the experience doesn’t really transfer, since each product has its own architecture. You’ll need an engineer to dedicate time and effort to understand LookML and fully make the most of Looker’s expensive offering.
- You get limited control over your design. Like all plug-and-play BI tools, Looker lacks full customization freedom. “You're never going to be able to make it look exactly how you want and it’s never going to feel like it's directly part of your platform, because it's [embedded] through an iframe,” says Henry Coleman, Co-founder and General Manager at LocalClarity.
“One thing is that Looker is not user-friendly to non-technical users. Someone with knowledge of Looker can understand it, but a person without any technical background finds it somewhat advanced or difficult to comprehend. Additionally, the pricing clarity when creating custom reports is not clearly mentioned. Another area for improvement is the pricing structure, and the performance is not optimal on large data sets.” — Looker user.
At a glance: Looker Embedded alternatives for SaaS and customer-facing analytics
Before writing this article, we investigated all the most popular alternatives to Looker embedded analytics on the market—including more BI-style platforms with AI capabilities, like ThoughtSpot (if you want that comparison too). Here, we’ll explore four of the best alternatives we found, including a purpose-built embedded analytics platform and our own product for building fully bespoke experiences.
1. Embeddable
Embeddable is a dedicated platform for building lightning-fast, fully bespoke user-facing analytics.
We know, from years of successfully running Trevor.io, that it’s not enough to design a dashboard on a BI tool and embed it into your app—at least not if you’re planning to add maximum value to your end-users through presenting them with data.
We also know how complex it is to build custom analytics from scratch. So, we built Embeddable, the solution that gives you the best of both worlds: the customizability of custom-built data analytics and the simplicity of a plug-and-play tool.
With Embeddable, you’ll get everything you need to deliver a remarkable, custom experience to your users, including:
- Front-end toolkit and component library. Incorporate the charts from our library and edit them in code. Want to add your own specialist chart? No problem - you have the full power to create whatever you need.
- A powerful no-code builder. The third part of this toolkit is a portal so your customer-facing teams can build and iterate upon your dashboards without needing to code. Instead, they use an intuitive interface with point-and-click functionality to build experiences that align with your brand. Unlike Looker Embedded, there’s no need for users to create a separate account or sign in.
- Custom Canvas Feature brings governed self-serve to your product by letting customers build dashboards from your own React components, fully aligned with your design system down to the pixel, so users can explore and build without breaking your underlying definitions or permissions.
- Infrastructure, built-in. Embeddable works behind the scenes to manage your security, performance, caching, and infrastructure requirements, including row-level security enforcement and multi-tenant analytics deployment, so a single setup can serve isolated data to different customers. It can also provide the end user with real-time data that loads instantly. Embeddable integrates with all major databases securely through a read-only transaction and lets you customize the cache for better performance and reduced data warehouse costs.
Embeddable follows a headless architecture approach, so we let you combine data models that keep your metrics and access rules consistent across dashboards, and charting components that you can tweak as needed. These definitions allow your customer-facing employees to intuitively create dashboards that align perfectly with your existing UX & UI.
What users say about Embeddable
Embeddable appeals to users because we allow them to create fully bespoke analytics experiences (in 10% of the time it would take them to build them from scratch), allll without sacrificing security, performance, or budget.
“Using Embeddable, we have successfully achieved our goal of building dashboards with a no-code solution that use our own components. The platform has allowed us to maintain our desired look and feel, ensuring a cohesive and professional appearance for our end users.” — Pierre Vaidie, Co-founder and Head of Engineering at Pledge.
“Embeddable has enabled us to improve the experience for our users in a way and timespan that we wouldn't have achieved otherwise.” — Bart Lammers, Co-Founder and CTO at Eyk.
Embeddable pricing
Embeddable offers a free Startup tier and a flat-rate Lite plan from $499/month, with no extra fees per user or viewer. Larger Premium and Enterprise deployments are quoted individually based on scope.
This pricing model for embedded analytics makes Embeddable scalable and very affordable for mid to large businesses, or products with a large or growing user base. “It has immediate ROI,” says Henry. “We’ve been using Embeddable for a month and already have positive ROI. The moment we don't have to build in-house, this tool has already paid for itself.”
Embeddable vs. Looker Embedded
The main differences between Embeddable and Looker Embedded include:
- Embeddable is a purpose-built product for building custom user-facing analytics, whereas Looker is a BI tool with embedding capabilities
- Embeddable embeds using web components so the analytics experience loads directly in your DOM, while Looker embeds using an iframe. This makes Looker’s dashboard feel foreign to your app
- Looker has limited customization options while you get full design freedom when using Embeddable
- At the Lite tier and below, Embeddable is more cost-efficient for businesses because it doesn’t scale pricing with users or viewers, while Looker charges per user type on top of an unpublished base fee
- Users report slow loading times with Looker, whereas Embeddable is built to load in under 100ms
Pro tip: If you’re already using Looker internally and have a large budget, you might benefit from the simplicity of sticking to the same tool for embedded analytics. However, if you want full customization freedom, a reasonable pricing model, and zero iframes, then Embeddable could be a better option for you.
2. GoodData

GoodData is an analytics software that allows you to create data visualizations and share them with your users (internal or external), with AI and agentic analytics now built into the core platform. GoodData's offering spans embedded analytics, analytics-as-code, data automation, data visualization, and a separate headless BI product. Here, we’ll focus on Embedded Analytics.
The platform uses drag-and-drop functionality to create fairly interactive dashboards. You can choose from a variety of out-of-the-box charting options, add filters, drill-downs and drill-throughs, and zoom features for better readability.
With GoodData, you can embed your dashboards through an iframe, a React SDK, or web components. Plus, you can use automation and predictive analysis to anticipate potential trends. That said, GoodData has a somewhat steep learning curve and lacks full customization freedom for embedded analytics.
What users say about GoodData
GoodData is one of the few BI tools that supports different embedding methods, rather than relying only on iframes. However, it takes time for users to get fully accustomed to the tool and can become limited with their menu of charting options.
“Overall, the product is highly flexible and has often exceeded our operational expectations. That said, one clear drawback is that setting up the more advanced dashboards can be quite time-consuming. Because the platform includes such a broad range of features, there’s a modest learning curve when it comes to finding the most effective KPI configurations, often through trial and error. This upfront complexity can sometimes slow down our ability to deliver critical insights to our internal operations and finance teams.” — Gina H., data analytics manager on G2
GoodData pricing
GoodData prices its Professional plan based on a platform fee plus the number of “workspaces” you need, rather than users or features—and since a separate workspace is usually required for each customer, costs can scale quickly. GoodData no longer publishes a starting price for either its Professional or Enterprise plans; both require contacting sales for a custom quote.
GoodData vs Looker Embedded
While GoodData and Looker are both predominantly BI tools with an embedding feature, they differ in these main ways:
- Looker only embeds through an iframe, while GoodData supports other options like web components and a React SDK
- GoodData prices based on the number of workspaces you need (typically one per customer), while Looker prices based on user license type—costs scale differently depending on whether you're driven by customer count or by your internal/external user mix
- Both GoodData and Looker provide limited control over the UX and UI
Pro tip: These two products allow you to model your data. GoodData does it through its headless BI; and Looker, through LookML. Don't assume GoodData is automatically the cheaper option: neither vendor publishes pricing anymore, and real-world GoodData spend has a median around $223,000/year, so get quotes from both before deciding based on budget alone.
3. Luzmo
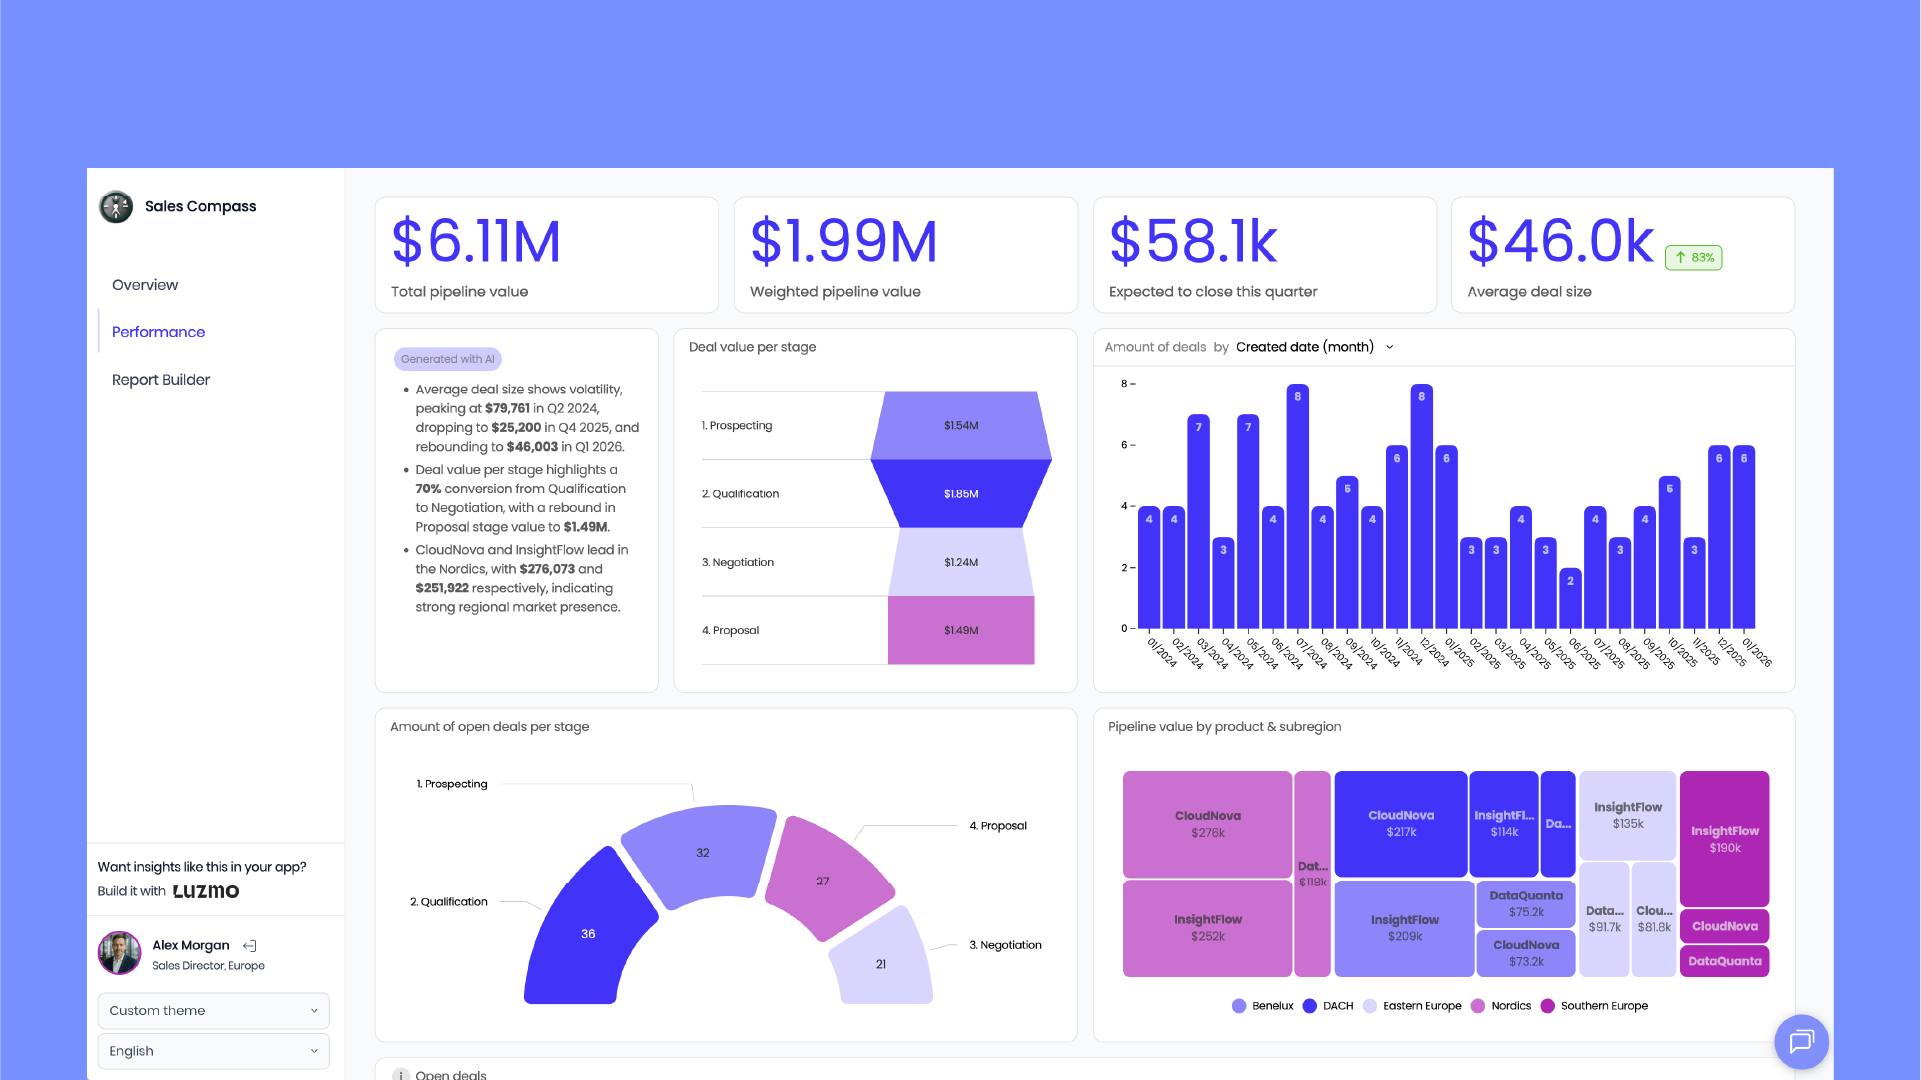
Luzmo (formerly Cumul.io) is a cloud-based, purpose-built platform for designing embeddable charts and analytics dashboards. While Luzmo isn’t a BI tool, it supports self-service analytics through an add-on that lets end users create and edit their own dashboards directly in their product.
Luzmo embeds using web components and offers a drag-and-drop interface for designing analytics experiences. Despite its ease of use, Luzmo isn’t the best option if you need to process highly complex data analytics. According to users, these take longer to build and require more time from your technical team. Plus, Luzmo doesn’t let you create custom formulas to organize and view the data.
What users say about Luzmo
Luzmo users enjoy Luzmo’s ease of use and intuitive interface, and that you can build interactive dashboards in hours. However, Luzmo limits how much you can customize your design and the UI gets harder to navigate with time.
“Luzmo's ability to do complex queries is limited, especially when setting up relationships between tables / datasets. While we are able to massage our data into a format that works with Luzmo, it's not the most elegant, as we are forced to denormalize data to accommodate Luzmo's querying ability.” — Shanti B., data engineer on G2.
Luzmo pricing
Luzmo has three pricing tiers, published in euros:
- Starter: €495/month—for teams getting started with customer-facing analytics. Includes drag-and-drop dashboards, but carries Luzmo's branding.
- Premium: €1,995/month—adds full white-labeling, advanced analytics, and AI-assisted dashboarding.
- Enterprise: Custom pricing—for larger deployments needing dedicated security, compliance, and SLAs.
- Pricing scales with monthly active users (MAUs) rather than a fixed viewer cap.
Luzmo vs. Looker Embed
Luzmo is different from Looker because:
- Looker is primarily a business intelligence software that supports embedding. Luzmo is a purpose-built embedded analytics platform
- Luzmo embeds through web components while Looker uses an iframe
- Luzmo is much more affordable than Looker as it’s built for end-users
- Looker is better for processing advanced data and highly complex queries
- Looker is a more advanced tool with enterprise features whereas Luzmo is more ‘lightweight’
- Both have a limited ‘menu’ of components that you can’t fully control or add to
Pro tip: Comparing Looker and Luzmo is like signing up for an F1 race with a Prius. A Prius is a perfectly good, gas-efficient car that’ll take you from A to B. You won’t win a NASCAR race but, then again, you don’t need a Ferrari to go to the grocery store.
In this case, Looker is like the Ferrari. It’s the more powerful choice for processing highly complex queries using a secure interface. However, if all you want is to add a little value to your end-user with a simple interface, Luzmo may get you there.
4. Sigma
Sigma Computing is a no-code self-service BI tool for business users. It connects to multiple data warehouses and most SQL databases. This business intelligence tool allows users to embed their dashboards or reports into other apps through an iframe.
Like Looker, Sigma is also cloud-based and allows users to build dashboards by choosing charts and visuals from its visualization library. It’s a mature tool, with a fairly shallow learning curve.
However, like many BI tools, Sigma has an opinionated UI. You get a menu of predefined charting components, but you can’t edit them as you would if the designs were part of your repo. And Sigma is still a costly option for many businesses, with no published pricing of its own.
What users say about Sigma
Users like that Sigma is easy to use and allows users to make more data-driven decisions. However, customization options are ultimately limited and using an iframe as an embedding method makes the analytics experience feel foreign to the rest of the app.
“Would be great to have a few more options for visual customization and export formatting, especially for more public- or customer-facing use cases.” — Kenn Z., director of product marketing via G2.
Sigma pricing
Sigma doesn't disclose its pricing on its website. Based on third-party transaction data, the median annual spend is around $62,000/year, with reported deals ranging from roughly $17,500 to over $130,000 depending on company size and license mix.
Sigma vs Looker Embedded
Sigma and Looker are both business intelligence platforms. Here’s how they compare:
- They both offer embedding capabilities through an iframe which can be slow and clunky
- Users say Sigma is much easier to set up than Looker—it’s more user-friendly and never requires users to have a Gmail account to view the data
- Neither vendor publishes pricing; real-world deployments for both are commonly reported in the same broad range (tens of thousands to well over $100,000/year depending on user count)
- Looker can process more complex queries than Sigma
- Both have a limited set of charts to choose from, with limited customization options
Pro tip: If your priority is simple UX and ease-of-use and then try Sigma. Meanwhile, Looker is the better option for very complex queries—or if you just want a Ferrari.
What about custom-built embedded analytics?
No BI tool in the market can offer the levels of customization and control you’d get from building your embedded analytics experience in-house. In fact, many of the best examples of user-facing analytics are custom-built.
But providing users with fully bespoke analytics is costly and time-consuming. You need to define security measures and data models and bring datasets together—not to mention design the different charts and visualizations your end-user is interested in.
So, to help you get the simplicity of use of a BI platform and the customization freedom of tailor-made experiences, we built Embeddable. With its headless approach, Embeddable gives you everything you would expect from the best embedded tools while giving you full control over the frontend, UX, and UI and embedding natively in your app.
Plan it right from the start: See our guide to embedded analytics requirements for a full checklist.
Which embedded analytics solution is right for you?
Looker Embedded is a potential solution for enterprise-grade businesses with a large budget—that don’t mind using an iframe. However, if that’s not you, here’s a quick recap of the best alternatives:
- You want to embed through web components and offer a native feel: Unlike the other tools on this list, Embeddable isn’t a simple out-of-the-box platform that comes with a limited set of pre-defined visualizations. You define your own components and data models in code, then assemble dashboards through Embeddable's no-code builder—or in code, or by prompting an agent—giving you the freedom to build the analytics experiences that you want and align with your brand.
- You're an early-stage startup without a dedicated data team: Looker's pricing isn't published and requires a sales conversation before you know what you're committing to, and LookML takes real engineering investment to use well. By contrast, Embeddable's free Startup tier is built for shipping a first dashboard without a budget commitment up front.
- You want more pricing transparency than Looker offers: Try one of the better BI platforms with embedded analytics capabilities, like Sigma. It’s cloud-based, has a range of charting options, and while it doesn’t publish pricing either, it at least gives you a clearer sense of real-world costs through third-party data. But if you’re looking for more control over the UX & UI, it’s still limited.
- You want a purpose-built tool:
- Luzmo offers slightly different pricing tiers that vary depending on your user base. This can make it more affordable than other similar options.
- GoodData lets you model your data in its semantic layer, which simplifies dashboard creation. Then, you can embed those analytics experiences into external apps with a web component.
All of these tools have their pros and cons. However, Embeddable is the only one from this list that gives you full flexibility and control over your analytics. Embeddable combines the customization of build from scratch with the simplicity of a SaaS tool, backed by transparent, predictable pricing that scales with what you actually need.
Discover a developer-friendly toolkit that’s purpose-built for creating remarkable customer-facing analytics in a fraction of the time. Learn more
Frequently asked questions about Looker Embedded alternatives
Is Looker the smartest choice for a startup that wants embedded analytics?
It depends on what you’re looking for, but generally, no. Looker is built for large enterprises already on Google Cloud with dedicated data teams. Pricing isn't published and typically requires a sales negotiation, and LookML has a real learning curve that needs engineering time some startups can't spare. Startups looking to ship embedded analytics quickly can get there faster with a purpose-built tool like Embeddable, or a simpler iframe-based option if full customization isn't a priority.
How does Looker Embedded compare to other tools on UI and white-labeling?
Looker and Sigma both embed through an iframe, which keeps the analytics visually separate from your app and can add loading lag. Embeddable and Luzmo embed using native web components instead, rendering directly in the DOM for a more integrated feel. White-labeling follows a similar split—it's a paid add-on on top of Looker's base platform fee, included by default with Embeddable, and available on Luzmo's Premium tier and above (Starter still carries Luzmo branding). GoodData includes white-labeling on both of its plans.
What’s the Microsoft equivalent to Looker?
The Microsoft equivalent to Looker is Power BI. It’s Microsoft’s self-service BI platform with embedding capabilities. Microsoft Power BI is quite popular because it was one of the first reliable options to hit the market and because of its ardent commitment to security.
When it comes to embedded analytics, neither can give you much control over the UX or UI of your charts and dashboards. Since both Looker and Power BI were primarily built for internal BI, their components will always feel foreign to your app. If that’s not a problem for your use case, Power BI may at least be a bit more affordable than Looker.
What’s the open-source equivalent of Looker?
Apache Superset is the open-source equivalent of Looker. However, to embed Superset dashboards, you may need to use the fully managed SaaS version called Preset. While the open-source version of Superset is free, Preset's managed Professional plan starts at $20/user/month. And, if you need to embed dashboards for external users, that requires a separate add-on starting at $500/month for 50 viewer licenses.
What are some cost-effective alternatives to Looker for embedded analytics?
Embeddable, Sigma, and Luzmo all offer more transparent pricing than Looker for embedded analytics, even if "cheaper" isn't always guaranteed. Here’s how they compare:
- Embeddable offers a free Startup tier and a flat-rate Lite plan from $499/month, with no per-user or per-viewer fees at that tier. It’s an SDK for building fully bespoke analytics in 10% of the time it would take to build from scratch.
- Sigma is another BI tool that embeds using an iframe. It doesn't publish pricing, and real-world costs can run comparable to or higher than Looker depending on scale.
- Luzmo is a purpose-built embedded analytics solution that embeds using a web component. It’s not as customizable as Embeddable, but its published pricing starts at €495/month for its Starter tier, making costs easier to predict upfront than with Looker.