.jpg)


The best customer-facing analytics experiences are intuitive for your end-user and blend seamlessly into your website or app. They empower users to make decisions based on real-time data and actionable insights.
For that to be possible, you need a solution that’s straightforward to set up and totally customizable according to your UX. Not only that, but truly remarkable, interactive dashboards need to be high-performing and fast-loading.
GoodData is a capable BI platform, but if your goal is to ship customer-facing analytics that feel native to your product, it has some limitations. Customization is constrained, the learning curve is steep, and costs scale in ways that become hard to justify as your user base grows. This article covers the best alternatives, focused specifically on the embedded analytics use case.
Discover a developer-friendly toolkit that’s purpose built for creating remarkable customer-facing analytics in a fraction of the time. Learn more.
GoodData
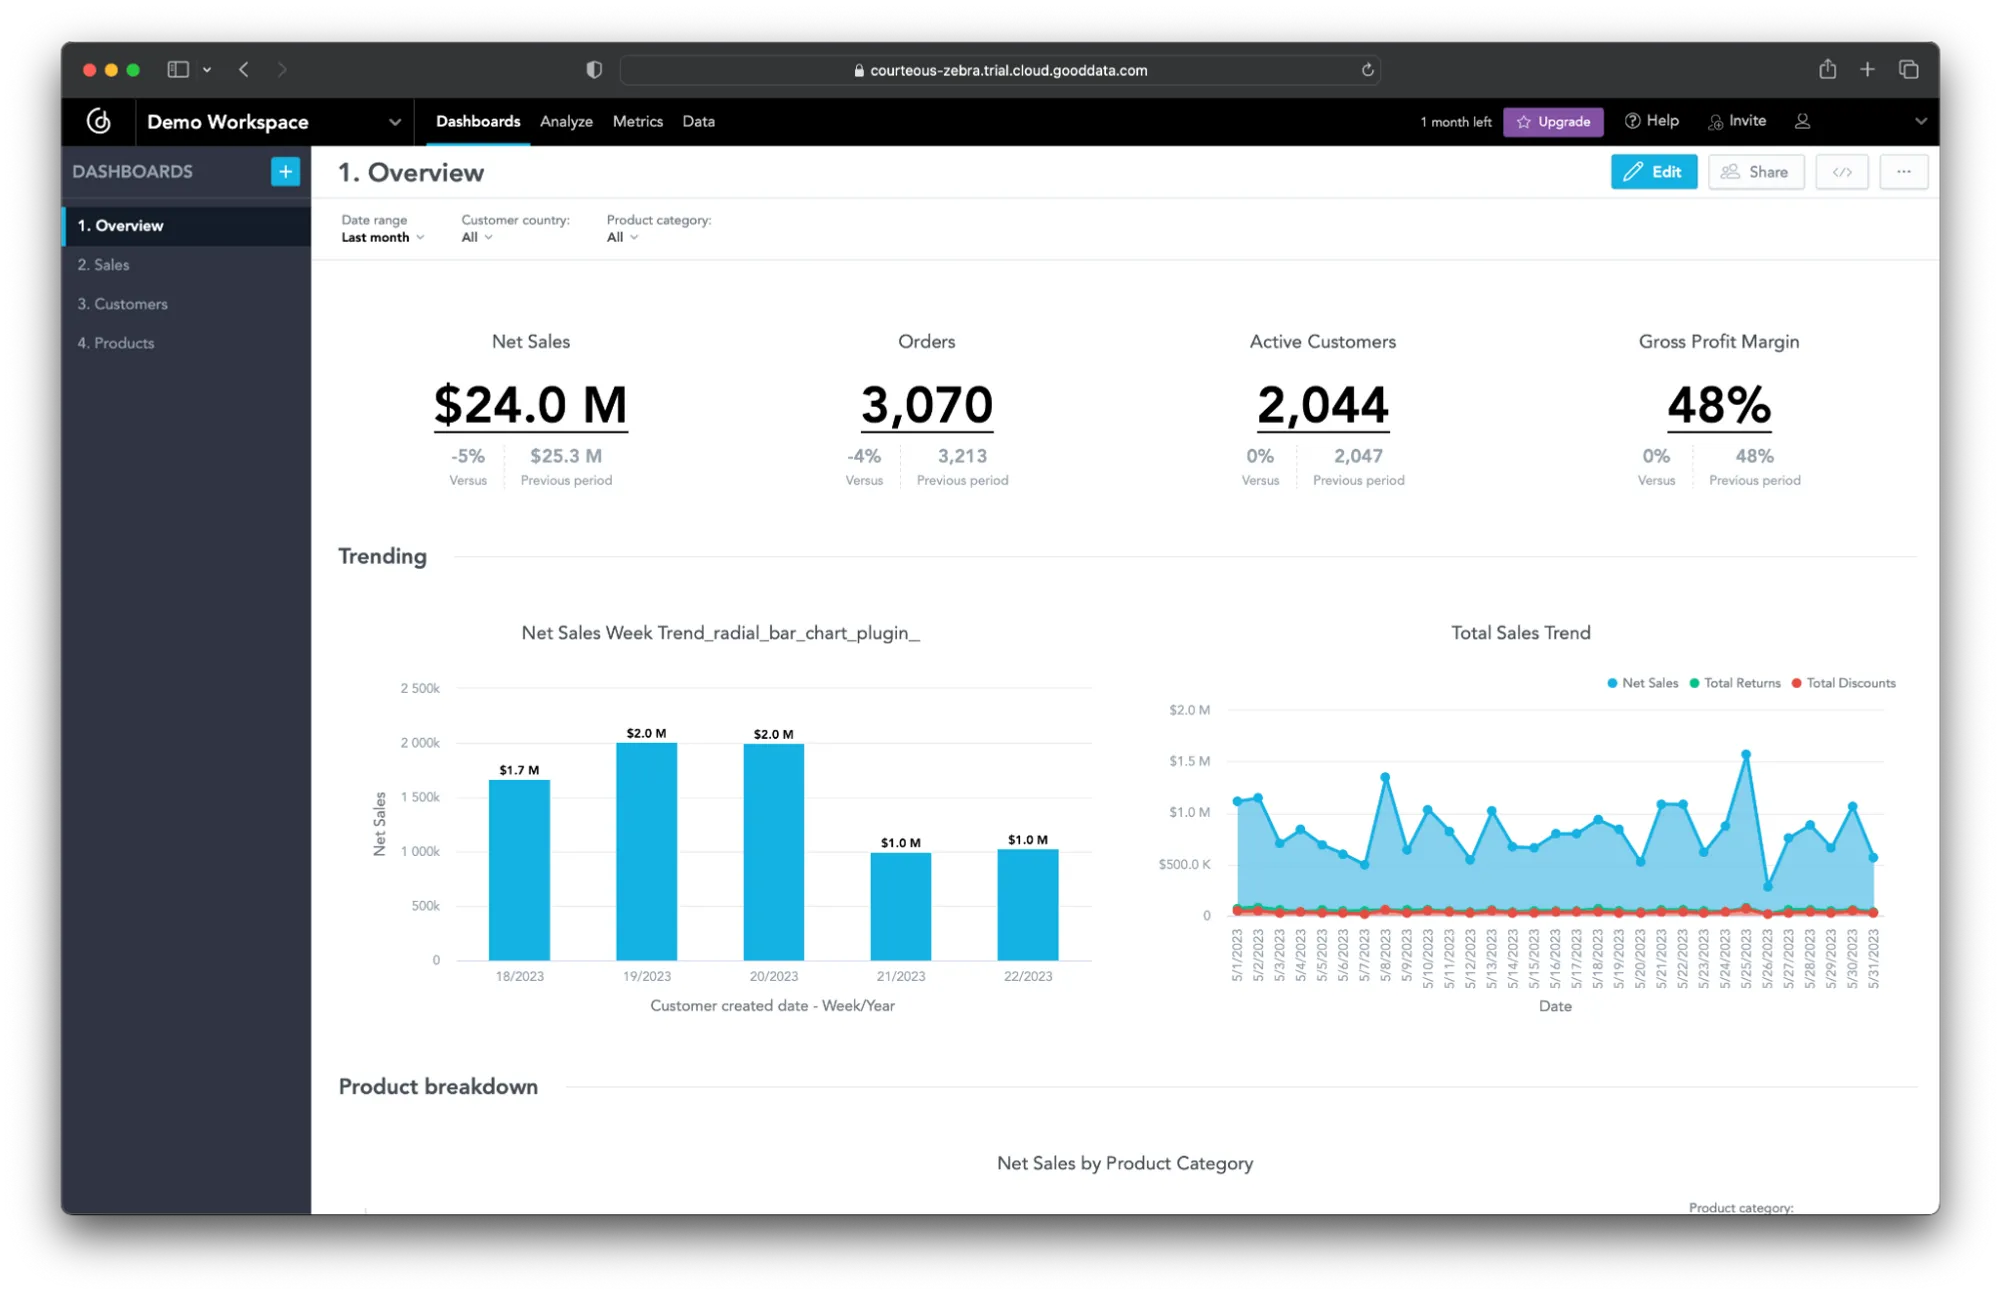
GoodData is, first and foremost, a cloud-based analytics platform for self-service BI. It has an AI assistant that supports non-technical users to search and analyze data using natural language.
So, rather than setting up a complex query, a user could ask “compare customer acquisition costs from the last two quarters” and get that data right away.
That’s one way GoodData tries to differentiate itself from competitors like Microsoft Power BI. For teams evaluating that route, see our Power BI embedded alternatives guide. Another is offering embedding via React SDK or web component—in addition to the traditional iframe option (which often results in slow, clunky loading experiences in your app).
GoodData works best when handling large datasets and running complex queries for internal use. Its multi-tenant analytics architecture, where each customer segment gets an isolated workspace, makes it a reasonable fit for SaaS teams serving multiple clients from a single platform. But when it comes to embedding, many users wish for more visualization options (more on this below).
Since you’re here looking for alternatives, let’s explore why and what solutions we can suggest.
Why you might look for alternatives to GoodData
You’d most likely choose GoodData if you need a mid-range embeddable BI tool and have a relatively static user base. Otherwise, the costs will start stacking up. But that’s not the only drawback:
- Customization is limited. Since you’re not dependent on iframe embedding, you get a more integrated experience with GoodData than, say, Tableau. But you can’t make edits in code. That means you can’t fully customize your analytics experiences to suit the needs of your end-user and the overall UX of your website or app.
- It’s not that easy to use. While the AI tool is intended to make the platform more accessible, users find the overall learning curve is steep. “I’d say the main downside is that the initial setup and learning curve can feel a bit overwhelming if you’re new to BI tools,” says a user on G2. “Some advanced features also require technical knowledge, so non-technical users might need extra support at the beginning.” Part of the problem is it uses a proprietary programming language, MAQL. It’s meant to be simpler than SQL, but users tend to prefer using the language they already know.
- Embedding via iframe has drawbacks. While GoodData supports web component and React SDK embedding, its default iframe option—and the one many teams start with—brings the usual limitations: slower load times, restricted UX control, and a dashboard that never quite feels native to your product.
- Self-serve has a ceiling. GoodData's AI Assistant handles simple natural language queries well, but deeper self-serve—custom metrics, complex data models, advanced dashboard configuration—requires working with MAQL, its proprietary query language. Users who want to go beyond pre-built dashboards often hit that wall quickly.
- It’s expensive for small businesses. GoodData has two tiers—Professional and Enterprise—but publishes no prices for either. You'll need a sales conversation before you know what you'll pay. Third-party sources estimate the starting point at around $1,500/month, billed annually, scaling per workspace. The Enterprise tier is required for the AI Assistant, audit logging, and HIPAA compliance. “I find current offerings expensive. Small and medium-sized businesses may find it a burden on their budgets.” says Sophiane D., an assistant using GoodData. You’ll also need to request a custom quote if you want more advanced security features.
"Setting up the more advanced dashboards can be quite time-consuming. Because the platform includes such a broad range of features, there's a modest learning curve when it comes to finding the most effective KPI configurations, often through trial and error. This upfront complexity can sometimes slow down our ability to deliver critical insights to our internal operations and finance teams."
— Gina H., Data Analytics Manager, G2
GoodData alternatives at a glance
Teams evaluating GoodData often shortlist enterprise BI tools like Tableau, Looker, and Qlik Sense, but these are primarily built for internal analytics and can become costly and complex when used for customer-facing embedded use cases.
In our shortlist, you’ll find top embedded analytics platform alternatives that are either cheaper, easier-to-use, or more flexible than GoodData. Here’s a quick overview:
Now, let’s review each alternative in more detail.
1. Embeddable
Embeddable is a headless embedded analytics solution built specifically for customer-facing analytics. Developers can control the experience in code while Embeddable handles the infrastructure underneath—from security and caching to performance and multi-tenant data isolation.
It’s the only solution that gives you full control over the code while taking care of the backend for you, offering a native feel without building your solution from scratch. Here’s how we do it:
- Next-gen embedding. Analytics are embedded using a web component—never iframe. Your dashboards load fast, directly in your DOM. With bi-directional communication between your charts and your app, your users get a more seamless experience.
- Front-end toolkit. You can use Embeddable’s out-of-the-box components or work with a charting library. Either way, you own the code in your git repo so it’s fully customizable and our SDK makes it simple to publish your charts.
- Backend engine. Row-level security (RLS), caching, and performance is handled by our backend engine. So, your components will interact seamlessly with each other. Embeddable integrates with the most common databases through a read-only transaction, so your data is secure and loads super fast. Plus, you can customize the cache for even better performance.
- No-code builder. You’ll need some developer input to get set up. After that, anyone can use the intuitive point-and-click interface (no coding required) to build and iterate on your dashboards. That’s one less barrier to remarkable analytics.
As a fully white-label dashboard solution, Embeddable removes all platform branding by default, so your analytics look and feel like part of your product from day one. With Embeddbale you'll also be able to give users real governed self-serve power with Custom Canvas — a flexible way for your customers to assemble their own dashboards using charts and components that match your design system exactly.
If you’re looking for one tool to handle both embedded analytics and internal BI, Embeddable probably isn’t the right choice for you. It’s purpose-built for embedding and doesn’t do internal BI.
But that means the tool is built specifically for the job of publishing dashboard and reports to your users in your application with full customization freedom, high performance, and no iframes in sight!. There’s no reason you should be stuck with an inflexible plug-and-play solution that doesn’t match your UX.
See examples of what you can achieve with full control over the UX and UI.
What users say about Embeddable
Embeddable users like how customizable Embeddable is, noting how easy it is to build custom dashboards in the no-code builder.
“Using Embeddable is making it easier and quicker to build insights and dashboards for our customers, enabling us to make changes in a no-code builder and deploy them without engineering input."
— Ritchie Cargill, Technical Lead at Resident Advisor
"This was the easiest/smoothest BI dashboard embedding process I've done (and not an iframe!! 😄)."
— Brent Scholl, Full Stack Web Developer at Parcelytics
Embeddable pricing
Embedded analytics pricing models typically scale with your user count or query volume. Embeddable pricing is different, as there are no per-user or per-viewer fees. Plans start with a free tier (3 dashboards, 200 sessions/month), a Lite plan at $499/month, and Premium plans at custom pricing for teams that need white-labelling, unlimited dashboards, SLAs, and advanced caching. All plans include unlimited end-users.
"When pricing is per dashboard viewer, it becomes commercially unviable. Embeddable offered the best package, fully customizable and a flat pricing."
— Rodel van Rooijen, Founding Engineer at Solvimon.
Embeddable vs GoodData
If you’re choosing between Embeddable and GoodData, bear these factors in mind:
- GoodData does internal BI as well as embedding. Embeddable doesn’t do internal business analytics. Instead, we focus on helping you create remarkable user-facing analytics experiences.
- Embeddable is more customizable. While GoodData offers a range of embedding methods, you won’t own the code. So, with GoodData, there’s a limit to how native your charting components will feel, which is defined by which controls they make available to you on a given chart.
- Embeddable offers a fixed price. If you expect usage to scale, GoodData could become less affordable over time. With Embeddable, you’ll only ever pay a fixed monthly fee.
- GoodData uses AI but might have a steeper learning curve overall. The AI Assistant is designed to help non-technical users build more quickly and easily. But overall, users report a steep learning curve.
Book an Embeddable demo to learn more
2. Sigma Embedded Analytics

Sigma is a cloud-based platform for self-service data analytics. It’s known for having a shallow learning curve and an intuitive user interface that’s quite similar to Excel. Sigma’s Embedded Analytics feature can be used to embed dashboards into your website or app using an iframe.
Here’s why people choose Sigma for embedded analytics:
- No coding experience required
- Out-of-the-box charting components for building simple dashboards
- Extensive integration with a variety of data sources including Snowflake, BigQuery, and Redshift
- Cloud-based architecture so you can scale as much as your budget allows
You can’t edit Sigma’s charting components in code, unfortunately. Thanks to iframe embedding and Sigma’s opinionated UI, it’s unlikely that your visualizations will ever load as fast as you’d like, or feel fully native to your app. But that’s true of most out-of-the-box solutions. For internal self-serve, Sigma's spreadsheet-like interface is strong—business users can explore data without SQL. For customer-facing use cases, iframe embedding limits how much of that flexibility carries through to your end users.
What users say about Sigma
Sigma is known for being easy to use, especially for those who are familiar with Excel. However, users wish there were more visualization options and a broader range of features.
"It's honestly the easiest BI tool I've used. Feels like a spreadsheet but it's pulling live data straight from Snowflake—no extracts, no stale data. Anyone can pick it up quickly, no SQL needed."
— Keerthan P., Associate Data Analyst via G2
"It's very easy to integrate, whether you use iframes or the SDK, and you don't have to code everything from scratch—you can simply bring the power of Sigma into your application. I also like that it lets users edit data directly in the UI and have those changes saved back to the data store."
— Ibrahim A., Analytics Engineer via G2
"While Sigma is very intuitive overall, some of the more advanced visualization options still feel limited compared to tools like Tableau. I'd also love to see faster load times on larger datasets."
— Daniel M., Lead Account Manager via G2
Sigma pricing
Sigma doesn't publish pricing—you'll need to go through sales for a quote. Based on Vendr data from 139 purchases, the median annual contract is $62,000/year, ranging from $17,390 to $132,507. Embedded analytics can significantly increase that figure on top of the base platform cost.
Sigma vs GoodData
Here’s how Sigma and GoodData compare:
- Sigma is very easy to use. Both platforms boast no-code UI, but Sigma is the more user-friendly out of the two, according to users.
- GoodData may end up costing more. It’s difficult to compare pricing since Sigma scales per creator while GoodData scales according to workspaces (customer segmentation). But if you need more workspaces than GoodData’s Pro plan allows, Sigma could be more cost-effective.
- Sigma only supports iframe embedding. One of Sigma’s biggest flaws is iframe embedding, which requires the end-user to load Sigma within your app so they can see your analytics. This could harm the UX, since you get no control over how Sigma’s analytics behave in your app.
3. Metabase Embedded
Metabase is a low-code business intelligence platform with cloud-based or on-premises hosting options. If you need a straightforward way to bring simple dashboards or charts into your application, Metabase Embedded Analytics might be the answer.
Here’s what you should know about Metabase:
- It uses iframe embedding by default, which is quick and easy to deploy but compromises the user experience and loading speeds. A React SDK (Modular Embedding) is available on Pro and above for teams that need more customisation and control.
- You can set up static or ‘interactive’ dashboards. The latter essentially embeds the full BI tool into your app, which is powerful but overkill for simpler use cases.
- It’s user-friendly at a basic level, but users will hit a steep learning curve if they need to process more complex data.
Compared to other BI platforms, Metabase is one of the most user-friendly and cost-effective ways to embed analytics into your website or app. However, it’s really only suitable if you want simple dashboards and don’t mind embedding their very opinionated UI into yours.
What users say about Metabase
Everyone remarks on how easy it is to do simple, ad hoc queries in Metabase. However, users report that it lacks visualization options and can be bogged down by slow loading speeds.
"This service is user-friendly for beginners. When I started my career, I used Metabase in the early days, and it didn’t take much time to understand the functionality. Overall, it feels developer-friendly and easy to get started with."
— Saurabh B., Software Engineer via G2
"While Metabase is great for basic and intermediate use cases, some advanced analytics features and customization options for visualizations are somewhat limited. Performance can also be sluggish with very large datasets."
— Mahesh V., Operations Analyst via G2
"Performance can sometimes slow down when working with very large datasets, complex SQL queries, or heavily filtered dashboards. Some advanced analytics and visualization customization features feel less robust than what you'd find in enterprise BI platforms."
— Bharat Singh B., Business Analyst via G2
Metabase pricing
For white-label embedding, you'll need the Pro plan, starting at $575/month (10 users included), plus $12/month per additional user. On annual billing that's $6,210/year plus $130 per extra user. At 1,000 authenticated viewers that's over $130,000/year—costs compound quickly if you're opening interactive embedding to a large customer base.
Anyone who signs in to view analytics is counted among billed users, so costs will rise further if you offer interactive embedding. If you offer static embedding, viewers can access analytics at no extra cost—but they won’t be able to run ad hoc queries or build their own dashboards. Interactive embedding lets your customers run their own ad hoc queries, but every authenticated viewer counts as a paid seat—so opening up self-serve to a large user base can push costs up quickly.
Metabase vs GoodData
- Metabase is easier to use if you just need simple dashboards. It’s low-code and very straightforward to set up. However, it’s not suited to advanced data modeling as the learning curve suddenly becomes very steep.
- Metabase is more cost-effective especially if your end-users don’t need ad hoc query access. Its fees scale per business user, so if your customers only require viewing access to static dashboards, it’s quite affordable.
- GoodData supports more embedding options while Metabase only offers iframe embedding.
Pro tip: If all you need to do is showcase some interesting statistics in your app, try Metabase. It can be cheap, depending on your use case, and it’s easy to deploy. If you want more customization freedom and interactivity, consider GoodData or another alternative on this list.
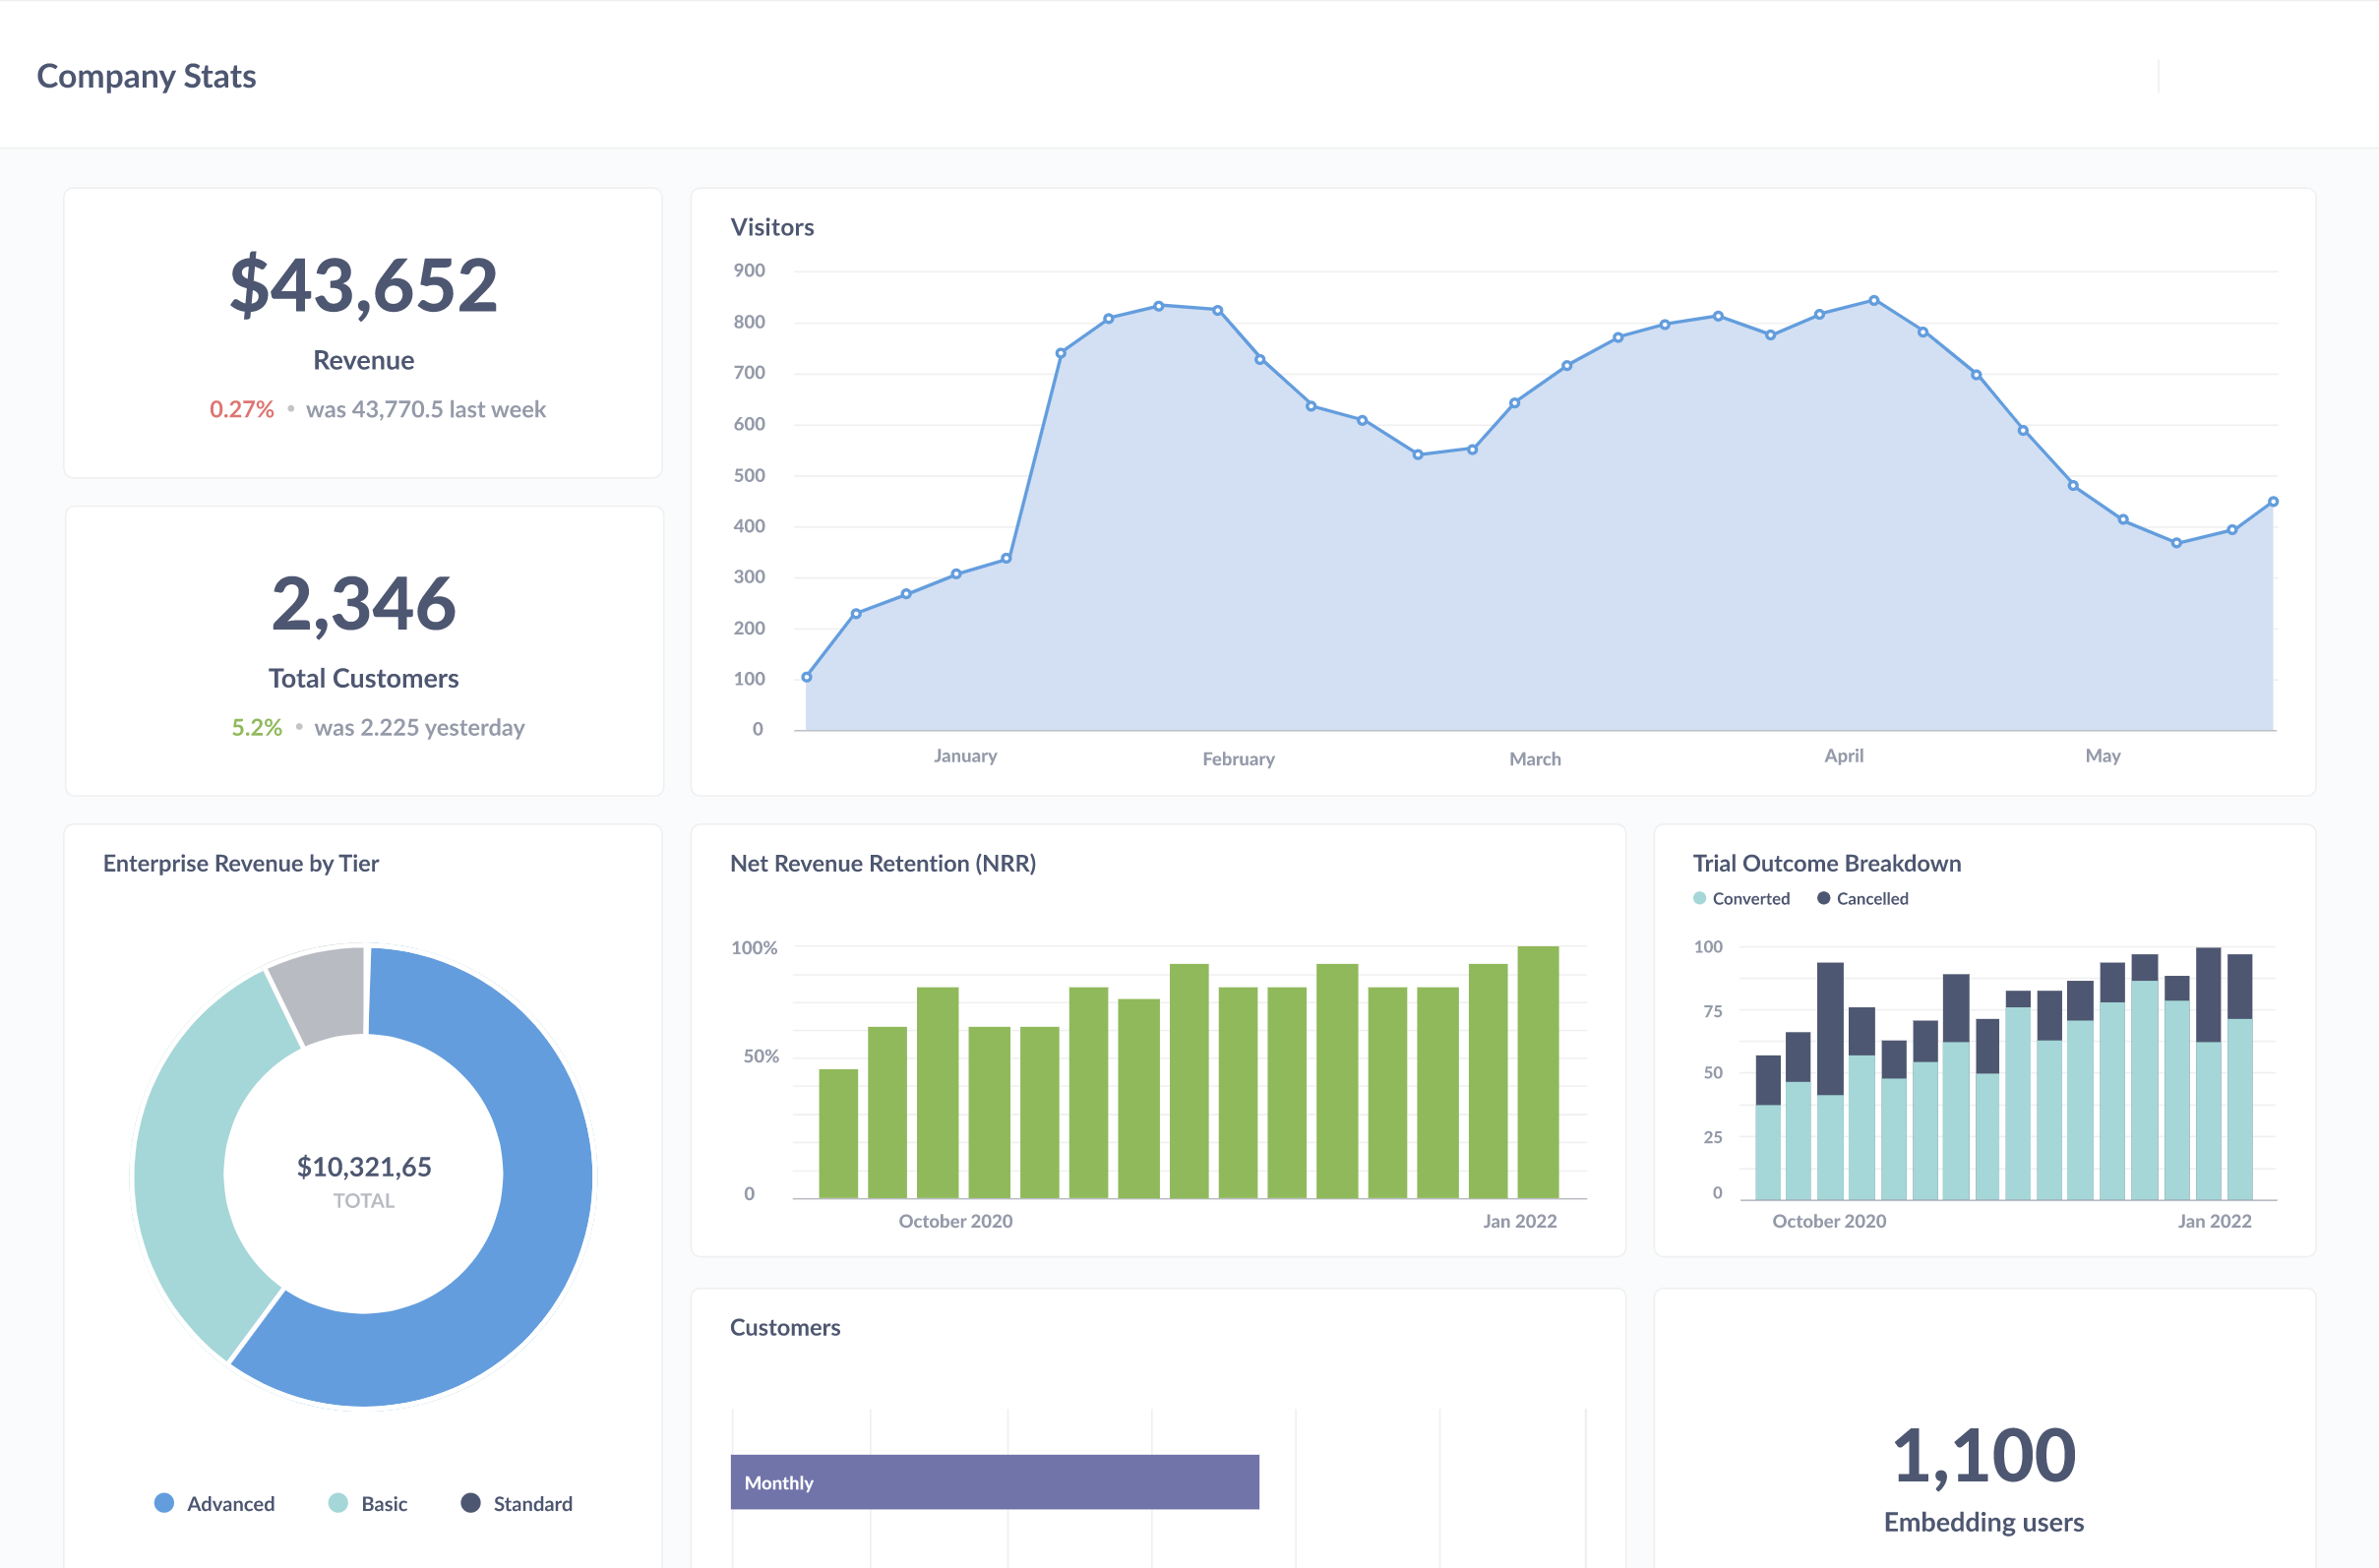
4. Sisense Embedded Analytics
![A web browser screenshot displaying the Sisense data analytics platform workspace titled "Ecommerce Demo [SNOWFLAKE]". The user interface features a left-hand navigation menu showing various categories like Energy, Finance, Insurance, and Healthcare, alongside a central dashboard containing five distinct data visualization cards.](https://cdn.prod.website-files.com/6481ad32387f691d7bbde9e5/6a3b198820b7ce6076ce1cba_Embedded-analytics-supply-chain.png)
Sisense is a mature embedded analytics platform with strong developer tooling and a long track record in the mid-market and enterprise space. Unlike Sigma and Metabase, which bolt embedding onto an internal BI tool, Sisense is built with embedded use cases at its core. It ranked highest for customer satisfaction in G2's Embedded BI Grid as of mid-2025.
Here’s what you can do with Sisense:
- Embed using iframe, Embed SDK, or Compose SDK for code-driven component embedding
- Build dashboards using a no-code drag-and-drop builder
- Use AI-powered natural language queries and automated narrative generation
- White-label the full analytics experience to match your product
Sisense uses a proprietary data caching engine called ElastiCube for data modeling—powerful for performance, but something users often flag as having a steep learning curve. Cube builds can get complex, and troubleshooting them requires solid technical knowledge. It's not a tool you deploy in an afternoon.
What users say about Sisense
Users value Sisense's flexibility and depth for embedded use cases, though many also note it takes real investment to get right.
"Like any complex platform, there is a learning curve when you first get started, particularly around data modelling and the initial setup of embedded environments. Some of the more advanced configurations can take time to get right."
— Elliot M., Product Manager via G2
"The 'compose SDK' is well documented and provides easy-to-follow examples for integrating within a React application. It's great that we can build Sisense into our product and offer useful information directly through the app."
— Verified User, Computer Software via G2
Sisense pricing
Sisense offers a Self-Serve plan you can start with a 7-day free trial and purchase directly without a sales call. Enterprise pricing is custom and requires contacting sales. No prices are published for either tier.
Sisense vs GoodData
Sisense and GoodData are closer to each other than either is to Metabase or Sigma — both are enterprise-grade platforms with multi-tenant architecture. Here's how they differ:
- Sisense offers more embedding flexibility. Iframe, Embed SDK, and Compose SDK give developers more options than GoodData's three methods, with a more developer-friendly SDK story.
- Sisense has a self-serve entry point. You can start a trial and purchase online without a sales conversation—GoodData requires a call for both plans.
- Both have a learning curve, but Sisense's no-code builder is generally considered more accessible day-to-day once you're up and running.
Pro tip: If you need a proven, enterprise-grade platform and have the engineering resource to invest, Sisense is worth a serious look. If you want full control over the experience without the implementation overhead, Embeddable could be a better fit.
What about custom-built embedded analytics?
One major drawback of GoodData is it lacks flexibility. There’s a limit to how much you can customize its charting components and it’ll always feel somewhat foreign to your app.
That’s OK if your priority is to give business users access to a few quick metrics. But if you want your customers to experience high-performing, interactive analytics that support their decision-making and fit seamlessly into your UX… most out-of-the-box solutions just aren’t good enough.
But that doesn’t mean your only option is to build your analytics from scratch. Custom embedded analytics are powerful, but building and maintaining the full infrastructure with permissions, caching, tenant isolation, and performance at scale is expensive and time-consuming (as we know from years of successfully running our BI platform, Trevor.io).
That’s why we made Embeddable. You shouldn’t have to settle for an inflexible embedding solution or drain all your resources on building analytics from the ground up. With Embeddable, you own the frontend code in your git repo, so it’s yours to edit as you see fit. It handles all of the backend whilst providing an intuitive no-code dashboard builder, so it only takes ~10% of the time vs. going for a fully custom build.
If you’re curious about Embeddable: Read the developer docs.
How to choose your embedded analytics solution
GoodData stands out as a data platform because it doesn’t rely on iframe embedding. But it loses points for customization, ease-of-use, and pricing. If that’s an issue, consider these alternatives:
- For fully bespoke analytics that feel native to your app, try Embeddable. You own the code while our backend makes sure everything performs highly and loads lightning fast. It’s the only solution that gives you full customization freedom without building from scratch.
- If you need simple charts and rapid deployment, consider Metabase. It’s low code and easy to embed, but you’ll sacrifice customization freedom and performance.
- For an all-round easy-to-use internal BI solution, try Sigma. It’s a shame that Sigma uses iframe embedding, because it’s otherwise an intuitive, mature tool. Best for when you need internal BI as well as embedding—and don’t mind sacrificing customization.
- For a proven enterprise-grade embedded analytics platform with strong developer tooling, consider Sisense. Be prepared to invest in implementation—but you'll get multi-tenant architecture, flexible SDK embedding, and white-labelling out of the box.
Discover a developer-friendly toolkit that’s purpose built for creating remarkable customer-facing analytics in a fraction of the time. Learn more.
Frequently asked questions about GoodData alternatives
What are some cost-effective alternatives to GoodData for small businesses?
Small businesses that need embedded analytics should consider Embeddable and Metabase as alternatives to GoodData. Metabase is widely considered one of the most cost-effective BI platforms, and offers static embedding at no extra cost on its Pro plan. However, if you want a more flexible solution, try Embeddable. With Embeddable, you pay a fixed monthly price with no hidden fees. Plus, you get more control over how your analytics look and behave in your app.
How does GoodData rate on review sites?
GoodData.AI is well-reviewed on G2, with users consistently praising its multi-tenant architecture and data governance, while common criticisms center on the learning curve and MAQL complexity.
Is GoodData good for embedded analytics in SaaS products?
GoodData is a reasonable fit for SaaS teams that need multi-tenant embedded analytics at scale. Its workspace-based architecture isolates each customer's data cleanly, and it supports iframe, web component, and React SDK embedding. The main drawbacks for SaaS use cases are the steep learning curve around its proprietary MAQL query language, pricing that scales per workspace as your customer base grows, and limited customization freedom compared to code-first alternatives. Teams that need full control over the end-user experience can find GoodData constraining.
How does GoodData pricing work?
GoodData uses a workspace-based pricing model. Each customer tenant gets its own isolated workspace, and costs scale with the number of workspaces you need. There are two plans: Professional and Enterprise. Neither publishes prices publicly; both require a sales conversation to get a quote. Third-party estimates put the starting point at around $1,500/month. The Enterprise plan is required for advanced security features like audit logging and HIPAA compliance.