Preset Embedded Dashboards: 4 Alternatives for better user-facing analytics
Preset is one way to go about embedding analytics, but it does have some drawbacks. Even with all the configurability of an open source platform, it doesn’t offer much flexibility when it comes to customizing your analytics experiences. In this article, we review Preset Embedded Dashboards and take a look at the best alternatives on the market.
Summarize with:
When embedding dashboards into your website or application, you want your users to experience remarkable analytics that empower them to make decisions based on data.
Preset is one of many tools that can help you achieve it, but it has some drawbacks. Apache Superset, the open source platform Preset is built on, is highly configurable—but that flexibility lives at the infrastructure level, not in what Preset itself exposes to you. As a result, Preset doesn't offer much flexibility when it comes to customizing your analytics experiences.
But here’s the thing: Most out-of-the-box solutions are even less flexible. Delivering fully bespoke analytics usually means building them from scratch (which is probably even more complex and time-consuming than you think). Hear us out.
Since you’re on this page, you likely want to hear about out-of-the-box solutions and alternatives to a Preset dashboard first. So, let’s review Preset together and look at the best alternatives on the market. We’ll talk about the custom-build problem later.
Each alternative on our list compensates for some of Preset’s limitations. That way, we hope you’ll find something that can deliver the unique experiences you want for your users and turn your existing dashboard into something exceptional.
Discover a developer-friendly toolkit that’s purpose-built for creating remarkable customer-facing analytics in a fraction of the time -- Get started with Embeddable today.
What are Preset embedded dashboards?
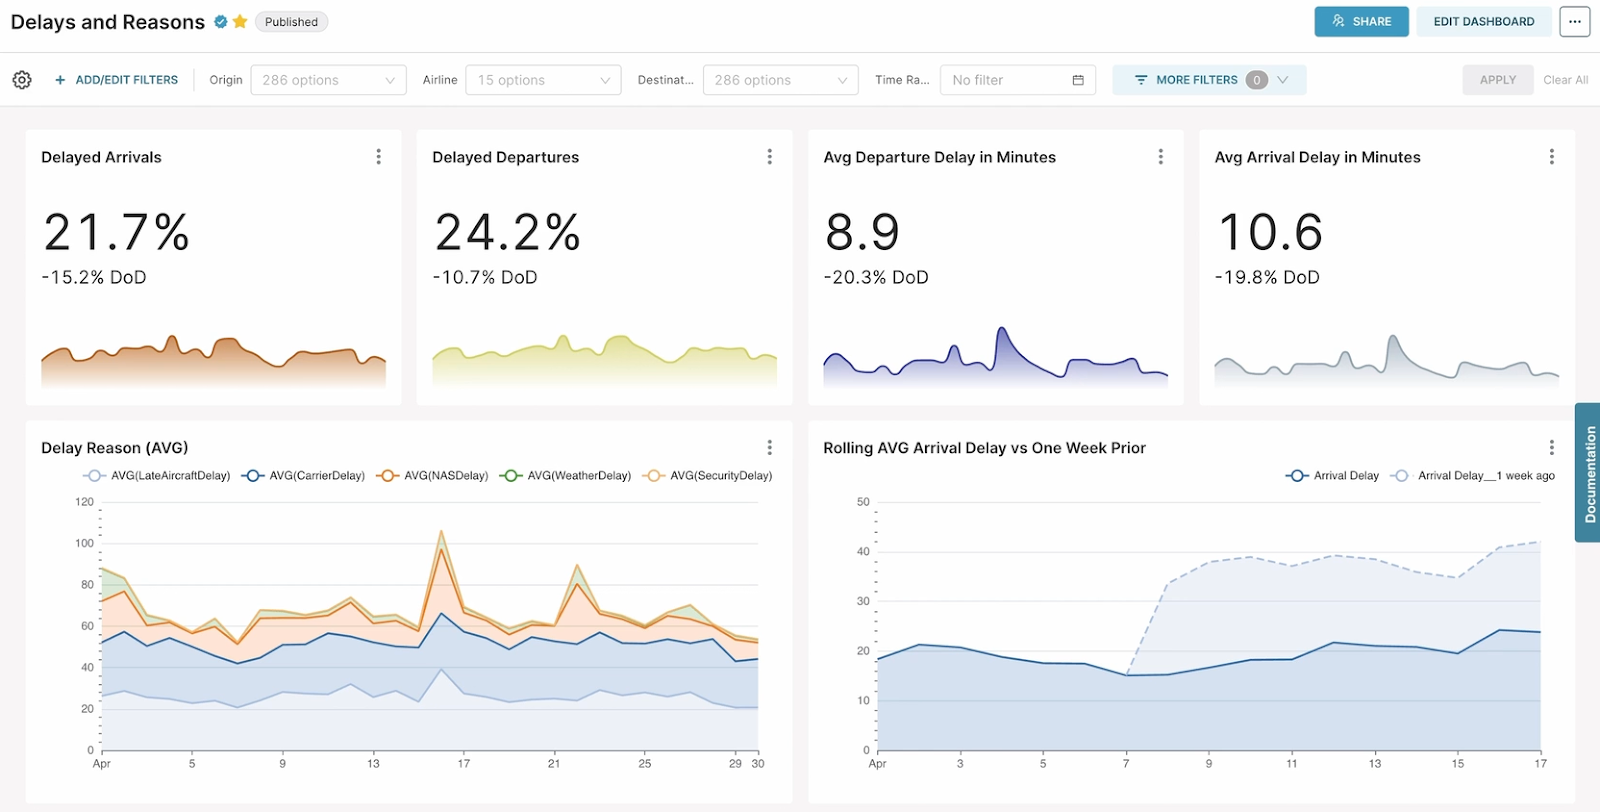
Preset’s drag-and-drop interface is intuitive at first, but you need coding experience to create highly custom charts. Source: Preset
First, there was Apache Superset, the open source platform for data exploration. Then came Preset, the fully managed SaaS version of Apache Superset.
With Preset, you can embed dashboards into your application’s front end via guest tokens, which let you control what data each embedded user can see while keeping the rest of your app’s authentication separate.
A Preset dashboard seems like a viable option if you want the benefits of open source but the customer service and support of a SaaS. It has a broad visualization library with a range of chart types. It also offers:
- Drag-and-drop user interface for simple Preset dashboard building and a variety of custom visualizations
- Control over what data is displayed to each user via row-level security (RLS)
- SQL Lab, a built-in editor that lets advanced users write, test, and explore data directly with SQL, on their own terms
Why you might look for alternatives to Preset
There are a few drawbacks to using a Preset dashboard for user-facing analytics. Let’s take a look:
-
By default, it embeds using iframe. With iframe, you don't get complete control over the code or how the analytics interact with the rest of your application. This embedding method also makes everything slower since the user must first load Preset within your app to view the data. Preset's Embedded SDK gives you more control than the iframe—responding to filter changes, custom CSS theming—but neither option lets you bring in your own charting code.
-
There’s a steep learning curve. Preset dashboards’ drag-and-drop builder is pretty intuitive and easy to use but only at a basic level. If you want to customize your analytics experiences and make the most of the open source platform, you must assign an experienced developer to the task.
“Unlike its competitors, it's quite challenging to use,” said a Data Analytics Manager on Capterra. “Some features, you can't really expect non-technical users to be able to utilize intuitively.”
- You don’t get complete customization freedom. Even experienced users report a lack of overall flexibility when adapting the code. You may end up with analytics experiences that don’t feel fully native to your app and don’t quite meet the end user's needs.
“There are lots of charts, but sometimes I wish I could customize little things in them, especially the fancy ones that need the data in a certain format to use,” says one user on the r/BusinessIntelligence subreddit.
- It could get really costly, really fast. Embedded dashboards are an add-on for the Pro plan, which starts at $20/month per user. However, Preset charges an additional $500/month for only 50 viewers of your embedded dashboards. It’s not the most appealing approach to pricing for embedded analytics, especially if your user base is large or growing.
Preset alternatives at a glance
We investigated the best embedding solutions on the market and shortlisted the best alternatives to answer Preset’s limitations: Embeddable, Sigma, Explo, and Metabase.
Here's a side-by-side comparison chart of how the four stack up on embedding, no-code support, self-hosting, and cost:
| Tool | Embed method | No-code builder | Self-hosting | Pricing |
|---|---|---|---|---|
| Embeddable | Web component (no iframe); cloud or self-hosted | Yes, plus end-user self-serve via Custom Canvas | Yes | Project-scope quote, unlimited usage, no per-viewer fees |
| Sigma | Iframe (URL-based) or React SDK | No—predefined chart menu only | No | Not published; median annual contract ~$63,500 (Vendr) |
| Explo | Web component (primary) or iframe | Yes (drag-and-drop) | No | Not published; new agreements quoted via Omni following the Explo–Omni acquisition |
| Metabase | Modular (SSO/Guest, can use SDK) or Full app (iframe) | Yes for simple dashboards; full BI tool exposed for full-app embeds | Yes—free open-source self-hosted tier | $575/month Pro (10 users included) + $12/user; embed viewers count as users |
1. Embeddable
With Embeddable’s software development kit (SDK), you can build fully bespoke, lightning-fast, user-facing analytics experiences—in just 10% of the time it takes to build from scratch.
Its headless architecture approach means your developers can combine data models and charting components—and tweak them to sit seamlessly in your existing UI.
With Embeddable, you get:
-
Next-gen embedding. Embeddable avoids iframe entirely and embeds using a web component instead. Without an iframe slowing things down, your dashboards load fast, directly in your DOM. This also enables bi-directional communication between your app and the embedded charts, meaning they blend into the overall user experience.
-
Front-end toolkit. We provide the charts; you bring them into your git repo and make all the edits you like. It’s pure code, so you can also work with an open source charting library (like Highcharts) or build your own. Our SDK makes it super straightforward to push your charts to Embeddable and create stunning interactive dashboards.
-
Built for agentic workflows. Because everything lives in your repo as versioned code—components, data models, dashboards—your team's AI tools and coding agents can scaffold, extend, and edit Embeddable dashboards the same way they would any other part of your codebase.
-
Backend engine. Our backend engine takes care of security and caching and makes sure every component interacts smoothly. Since you can customize the cache, your charts will be high-performing. Your customers get real-time data and impressive, interactive dashboards. Plus, it’ll connect to most databases through a secure, read-only transaction.
-
No-code builder. You need some developer input to set it up with Embeddable. But after that, the intuitive point-and-click interface can be used by anyone to build and iterate dashboards—no coding required. That’s one less barrier to remarkable analytics that aligns with your brand and meets user needs.
-
True self-serve with Custom Canvas. Your users can build dashboards themselves using the same charts and UI components you ship in your app; ensuring perfect design consistency and a seamless UX.
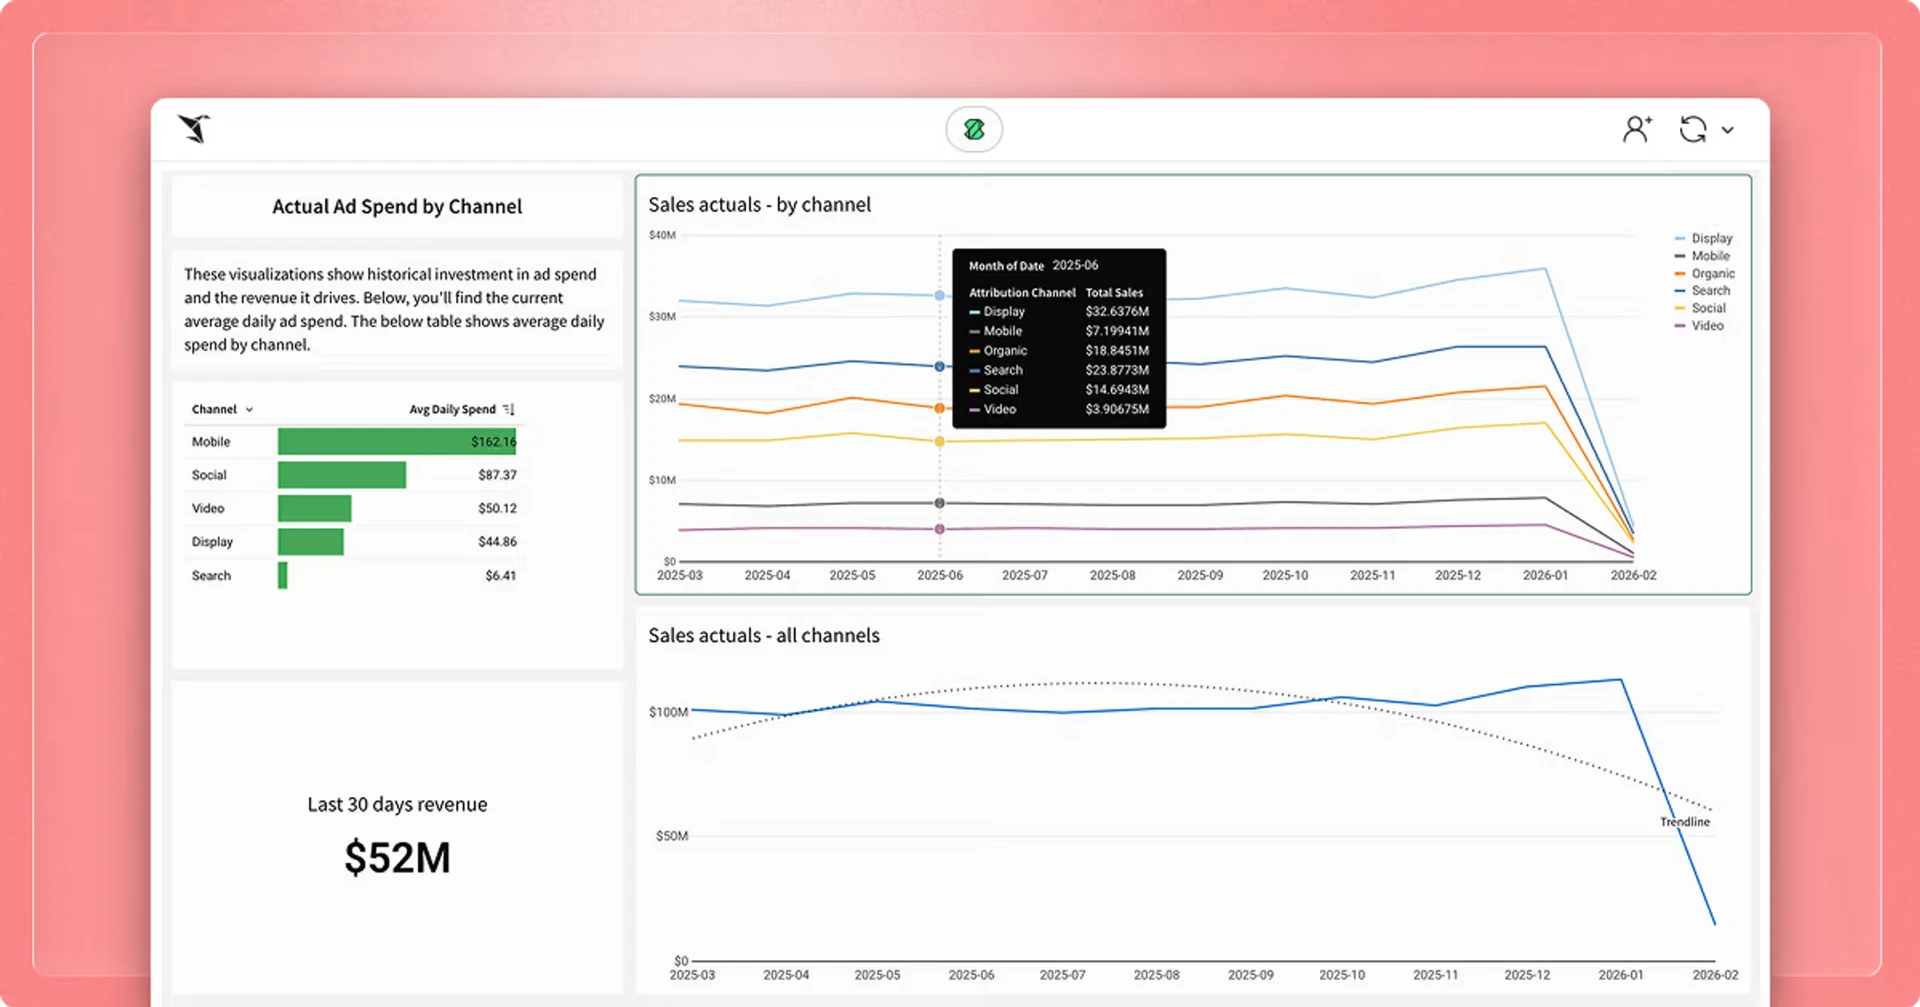
See what you can achieve when you’ve got full customization control: Examples of analytics experiences built with Embeddable
What users say about Embeddable
Developers, designers, and product people already use Embeddable to pioneer with next-gen embedded analytics experiences and interactive dashboards.
They like it because they can create native-feeling experiences with live data, but it’s much faster and more straightforward than creating dashboards by coding from scratch.
"Embeddable is making it easier and quicker to build insights and dashboards for our customers, enabling us to make changes in a no-code builder and deploy them without engineering input." — Ritchie Cargill, Technical Lead at Resident Advisor
“This was the easiest/smoothest BI dashboard embedding process I’ve done (and not an iframe!! 😄). Thanks a lot guys. 🙌” — Brent Scholl, Full Stack Web Developer at Parcelytics.
“Embeddable has enabled us to improve the experience for our users in a way and timespan that we wouldn't have achieved otherwise.” —Bart Lammers, CoFounder and CTO at Eyk
Embeddable pricing
With Embeddable, you pay a flat monthly rate without additional fees per users, viewers, or dashboards. Pricing is unlimited-usage and fully white-labeled by default—and quotes are based on project scope rather than a published price list. If you expect usage to grow, this could be a powerful but affordable solution.
"One of our use cases is to provide embedded analytics to the customers of our customers. When pricing is per dashboard viewer, it becomes commercially unviable. Embeddable, offered the best package, fully customisable and a flat pricing." —Rodel van Rooijen, Founding Engineer at Solvimon.
Embeddable vs Preset embedded dashboards
If you’re choosing between Preset and Embeddable, consider this:
-
Embeddable offers next-gen embedding via a web component while Preset embeds using an iframe.
-
You’ll get lightning-fast loading speeds with Embeddable as it offers you a configurable caching layer and doesn’t have to load an iframe first, unlike Preset.
-
Both provide a library of visualizations, but with Preset, users find it difficult to fully customize them and add advanced components. With Embeddable, you own the code. That means you can use any charting library you like, and easily bring in elements from your existing design system.
-
Both offer no-code builders for non-technical users. Both also require developer input, but Preset’s learning curve might be steeper overall.
-
Embeddable offers fixed pricing, whereas using Preset for interactive dashboards could get costly as you scale.
Pro tip: If you’d really prefer not to touch any code, and don’t need a bespoke UX and fast loading speeds, Preset will do—especially if you can keep costs down with 50 viewers or less.
However, if you think your usage could scale and want high-performing analytics that fit seamlessly with your brand and UX, go for Embeddable.
“Embeddable is the first tool I’ve seen where it’s so straightforward to work with the data and build charts. It feels like the heaving lifting is done once I finish modeling my data.” — Adeola Morren, founder of iBenjamen Studio.
2. Sigma Embedded Analytics
If you’re familiar with spreadsheets, you can probably build a dashboard on Sigma. It uses a very similar interface. Source: Sigma
Sigma is a cloud-based data visualization and modeling platform—in other words, another business intelligence tool with embedding capabilities. However, it’s a mature tool with a shallow learning curve, which is what earned its spot on our shortlist of Preset alternatives.
Sigma also:
- Connects to a big range of data warehouses and SQL databases, including Redshift, Snowflake, BigQuery, and MySQL
- Supports RLS and single sign-on (SSO) options
- Has a visualization library with different chart types for building simple dashboards, though performance can lag on complex workbooks with large datasets as you scale
The interface is similar to most spreadsheet tools, so you can build dashboards without any coding experience. Sigma supports both iframe and React SDK embedding.
The downside is that you can’t edit charting components in code, and Sigma has a fairly opinionated UI. So, there's a good chance your embeds will feel foreign to the rest of your app.
What users say about Sigma
Sigma has a strong reputation for ease of use and integration. But for many users, the trade-off shows up once it's time to style the embed. Getting it to match the rest of the app can be harder than getting it connected.
“There are some aesthetic limitations, the learning curve is short, and the mobile version isn't very intuitive.” —Akram S., Sigma user
“I like that it's very easy to integrate, whether you use iframes or the SDK... Sometimes it's difficult to make the Sigma panel look exactly like the application design. I find the styling options somewhat limited.” —Ibrahim A., Sigma user
“Performance lags with complex workbooks and the limited visual customization... Fine-tuning the pixel-perfect look of a chart, like specific border thickness, custom color gradients, or unique chart types, is more restricted in Sigma." —Venkata M., Sigma user
Sigma pricing
Sigma doesn't publish pricing on its website — you'll need to contact sales for a quote. According to Vendr's transaction data, the median annual contract is around $63,500, with most buyers paying somewhere between $17,500 and $135,000 depending on user count and tier.
Sigma differentiates between Creator licenses (for people building dashboards) and cheaper Viewer/Explorer licenses, so your total cost depends heavily on how many people on your team need to build versus just view.
Sigma Embedded Analytics vs Preset Embedded Dashboards
The main differences between Preset and Sigma are:
-
Sigma is more user-friendly, according to reports from users.
-
Preset's pricing is public and predictable at smaller scale ($500/month for 50 viewers). Sigma's typical annual contract is far larger—Vendr puts the median at around $63,500—reflecting its broader BI platform scope versus Preset's narrower embedding add-on.
-
Sigma and Preset embed using an iframe, negatively impacting loading speeds and the general user experience.
Pro tip: If you want a tool that’s user-friendly from the get-go, that’s Sigma. It’s also worth getting a quote from Sigma if you expect to have more dashboard viewers than creators.
That said, Preset does beat Sigma when it comes to customization. You can’t edit everything in code, but you do get access to Apache Superset’s open source library of charts and graphs.
3. Explo
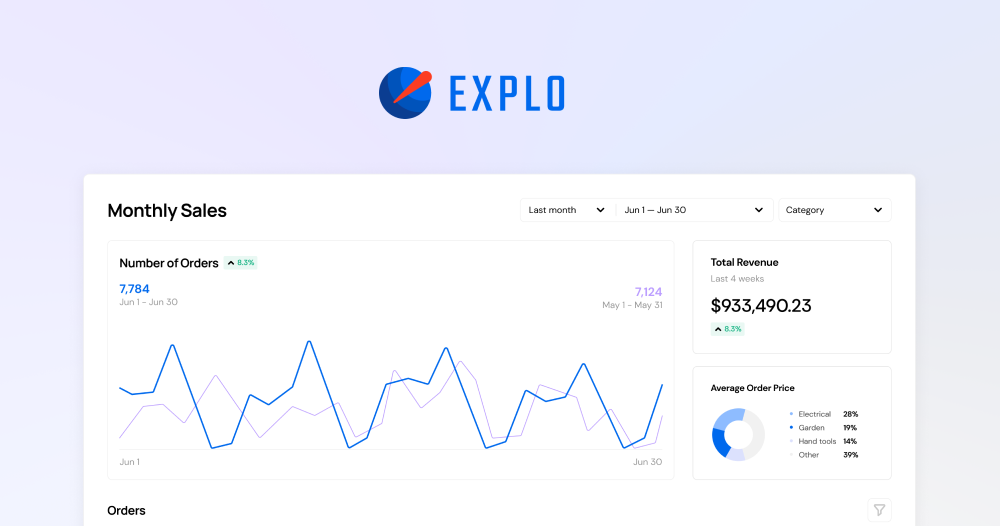
Explo users can choose to embed using iframe or web components. Source: Explo
Explo is a purpose-built embedded analytics platform. Unlike Preset, Sigma, and other popular BI tools, it’s designed with end-users in mind rather than internal business users.
Before you evaluate Explo on its own merits: in October 2025, Explo was acquired by Omni and is now a wholly owned subsidiary. Existing customers keep full access to Explo for 12 months while Omni manages the migration, after which the standalone Explo platform will be sunset. If you're picking a long-term alternative to Preset, keep in mind you'd be evaluating Omni within the year, not Explo.
With that caveat, here’s what you need to know about Explo:
- It embeds primarily via web component, with other delivery options including email and shareable links
- Its visualization library is less corporate than other traditional BI tools
- Users can download and configure reports as well as view dashboards
- Building dashboards is easy with the no-code builder
- It connects to relational databases and warehouses directly, without requiring data replication, and offers enterprise-level security
While Explo’s graphs are aesthetically pleasing and customizable to a degree, it’s worth noting that you still won’t be able to make them feel like a native part of your application. You can’t bring in your own charts, either. It’s a quick fix for modern visuals but not the best solution for a fully bespoke analytics experience.
Explo pricing
Explo's pricing page is no longer live, and the company isn't taking on new standalone customers in the usual way—new and prospective customers are directed toward Omni instead. If you're an existing Explo customer, your current contract pricing holds until you migrate; everyone else will need to get a quote through Omni rather than Explo directly.
What users say about Explo
Explo is fast to set up and embed—most reviewers say so. However, a few users report a steeper learning curve than expected and that dashboards are harder to build out than the speed promise suggests.
“It's very flexible—you can connect data sources quickly, customize the visualizations to fit your needs, and embed them seamlessly into your own product. The speed to create something polished and client-ready is a big win.” —Sowmiya R., Explo user
“Customer facing dashboards implementation is quite complex. Learning is difficult due to unintuitive design." —verified Explo user
Explo vs Preset embedded dashboards
If you’re choosing between Preset and Explo, consider these factors:
-
Explo embeds primarily via web component, which should give you a smoother, faster UX than Preset’s iframe embedding.
-
Preset is built on open-source Apache Superset, so you’ll have a bigger pool of visualizations to choose from and customize. However, neither tool gives you complete freedom to edit the code.
-
Preset's pricing is public and predictable for smaller embedding needs ($500/month for 50 viewers). Explo's pricing isn't published, and going forward you'd be quoted through Omni rather than Explo directly.
-
Like most out-of-the-box solutions, Explo has a fairly opinionated UI. However, its visualizations are less corporate in design.
Pro tip: If customization isn't too much of a priority for you, Explo is easy to use and quick to deploy with no-code dashboard builders—but given the Omni transition, it's worth asking about the platform's long-term roadmap before committing. If your team has the resources to get to grips with Preset, you may find it offers a clearer long-term path right now.
4. Metabase Embedded
Metabase is easy to use if you’re satisfied with very simple dashboards and queries. Source: Metabase
Metabase is a BI platform with the option to host on-premise or on the cloud. It prides itself on being low-code, with no knowledge of SQL required to build charts and dashboards. Its embedding options range from simple "guest" embeds of individual charts and dashboards, available on every plan including the free self-hosted version, up to full SSO-based embedding with drill-through and query builder access, or embedding the whole Metabase app in an iframe.
With full SSO-based embedding, your end users get access to more of the underlying BI tool, including drill-through, the query builder, and even AI chat. That’s powerful, but could be overwhelming if they don’t have a background in analytics. Familiarity with a full BI tool requires a steep learning curve.
However, for basic queries, Metabase is known for its user-friendly interface. It can also process complex data through SQL scripts and interactive visualizations. But non-technical users say getting actionable insights on complex data is much more difficult.
What users say about Metabase
For simple dashboards, Metabase is very low-code and easy to use. However, some users report slow loading speeds and limited visualization capabilities.
“Performance can sometimes slow down when working with very large datasets, complex SQL queries, or heavily filtered dashboards.” —Bharat Singh B., Metabase user
“It doesn't support very complex calculated fields or row-level security without workarounds... performance tends to degrade when dealing with very large datasets or high query volumes. Customizing visuals is also somewhat limited—you don't get the same depth of control over chart formatting.” —Gorav A., Metabase user
“Working with bigger teams might be difficult due to the absence of fine-grained access constraints... unless you purchase the more expensive edition, audit logs and copying tools are rather poor." —Sampath K., Metabase user
Metabase pricing
If you’re on a tiny budget, it’s worth knowing that Metabase has a free, self-hosted, open-source tier with unlimited users—but no embedding. For embedding, you'll need the Pro plan, which starts at $575/month and includes 10 users, with each additional user costing $12/month. Both your internal team and the people viewing your embedded dashboards count toward that user total.
Metabase Embedded Analytics vs Preset Embedded Dashboards
Here’s how they compare:
-
Metabase is very user-friendly, with a no-code builder for simple dashboards and queries.
-
Preset is more customizable when it comes to visualizations and has more granular security settings.
-
Which is cheaper depends on your mix of internal users and external viewers: Metabase's embedding-capable Pro plan starts at $575/month for 10 users (then $12/user), while Preset's embedding add-on is $500/month for 50 viewers on top of its own per-user fees.
-
Like Preset, Metabase is built on top of an open-source tool. Just know that if you use it for free, your visualizations will say “Powered by Metabase,” and you’ll need to self-host it.
-
Both can feel like an external tool dropped into your app rather than a native part of it.
Pro tip: Preset doesn’t give you full customization, but it is a little more flexible than Metabase, particularly when it comes to security. However, if you need a cheap solution that’s very easy to use at a basic level, consider Metabase.
What about custom-built embedded analytics?
We’ve talked about some of the best embedding solutions on the market. But almost all share a common flaw: limited customization options and opinionated UI.
With customer-facing analytics, you want as little friction for the end user as possible. That way, they can use the data to its full potential and get a positive impression of your solution. Unfortunately, most out-of-the-box embedding tools will feel foreign to your app—because they are!
We know, from years of running Trevor.io, just how complicated and expensive building analytics experience can be. That’s exactly why we built Embeddable: to save you the “build vs buy” headache.
Embeddable gives you full customization freedom, since all the code lives in your git repo. It also uses web component embedding (no iframes) for a more seamless UX. All that, and you can still deploy analytics experiences in 10% of the time it would take to build from scratch.
If you’re curious about Embeddable: Read the developer docs.
How to choose your embedded analytics solution
If you’re having doubts about using Preset for embedded analytics, here’s a quick guide to choosing an alternative:
-
For fully-bespoke user-facing analytics, try Embeddable. It’s the only option that gives you complete control of the UX through code. It’s also lightning-fast with next-gen embedding (no clunky iframes), and faster to deploy than building a custom experience from scratch.
-
For a user-friendly all-round BI tool, go for Sigma. Sigma’s main drawback is its default iframe-based embedding (read: foreign-feeling embeds and clunky UX), though a React SDK is available if you want more control. If embedded analytics is only one aspect of your use case, and you really want a user-friendly BI tool, Sigma could work for you.
-
If you want to move fast with a purpose-built tool, Explo could be the one—for now. It doesn’t give you control over the code, but its visualizations are varied and less corporate than most BI tools. Before you commit, remember that Explo was acquired by Omni in October 2025, and the standalone platform will be sunset within 12 months.
-
To keep it very simple and low budget, consider Metabase. Of all the internal BI solutions, it’s one of the more affordable and user-friendly options, provided you stick to its simpler "guest" embeds and don't need to process complex data. Go further with full SSO-based embedding and you'll be compromising on UX, since it exposes more of the underlying BI tool.
Comparing against other BI tools? See our guides to Tableau alternatives, Power BI embedded alternatives, and Looker embedded alternatives.
As you can see, most out-of-the-box solutions aren’t fit for purpose if you want native-feeling, remarkable analytics experiences that load fast and empower your end-users. Some rely on iframe embedding by default, give you little or no access to the code, and have very opinionated UI.
That’s why we built Embeddable. We combined the flexibility of custom-built analytics with the simplicity of a plug-and-play tool. The difference is you own the code while we handle the backend, with pricing that scales by usage rather than viewer count.
Discover a developer-friendly toolkit that’s purpose-built for creating remarkable customer-facing analytics in a fraction of the time. Get access to Embeddable today.
Frequently asked questions about Preset alternatives
Is Preset the same as Apache Superset?
No. Apache Superset is the free, open-source version you self-host yourself. Preset is the commercial, managed version, built by the same team, with hosting, support, and embedding included. Want to stay open-source and self-host? Go with Superset, not Preset.
Does Preset support no-code dashboard building?
Yes, for basic dashboards. Preset's drag-and-drop builder handles most dashboard creation without code. Customizing charts beyond the defaults, or working with the data models underneath, needs SQL.
Can I embed Preset dashboards in an enterprise application?
Yes—via the Embedded SDK or a simpler iframe embed. Both support row-level security and guest tokens, so each customer only sees their own data. The SDK gives you more control (filter events, custom CSS, hiding Preset's UI); iframe is faster to set up but less flexible.
Is Explo still a good Preset alternative?
Not for the long term. Omni acquired Explo in October 2025. Existing customers keep access for 12 months, then Explo gets folded into Omni and sunset. Pick Explo today and you're really picking Omni within the year.
Which Preset alternative is cheapest for embedding?
Preset's own embedding add-on is the most transparent at $500/month for 50 viewers. Beyond that, it depends on your mix of internal users and external viewers. Honestly, Metabase and Embeddable price differently enough that the cheapest option varies by use case rather than having one universal answer.