Metabase vs Power BI Comparison
We compare Metabase vs Power BI, going into the ease of embedding, data visualization capabilities, pricing and much more.
Summarize with:
The business intelligence tools market is booming compared to just a few years ago. In addition to veterans such as Power BI, newcomers like Metabase offer advanced analytics capabilities, great visualizations, and embedding capabilities.
But is it worth the risk to choose the underdog instead of a reputable BI tool such as Power BI? Today, we examine both tools to help you choose the right one for your internal reporting or customer-facing dashboards.
Metabase and Power BI at a glance
Metabase is an open-source BI tool designed for simplicity and fast setup. It allows teams to quickly build and embed basic dashboards, making it ideal for startups and SMBs. It offers straightforward pricing and easy self-hosting options.
While its open source nature is a major benefit, many businesses look at Metabase alternatives when they need robust embedding.
Power BI is a Microsoft product that excels in advanced analytics, data modeling, and integration with Microsoft’s ecosystem (Azure, Office 365).
It is a great fit for enterprises that need complex data analysis, as it provides extensive visualization tools and robust embedded analytics through Power BI Embedded. However, licensing or premium capacity requires more setup effort, technical expertise, and budget planning. This is the most common reason why businesses look into Power BI alternatives.
Metabase vs Power BI: user interface and experience
Both business intelligence tools offer a large variety of features for internal and external reporting. However, only one is a good option if you're looking for a clean and intuitive interface.
Ease of use and interface design
Metabase is often praised for its clean, intuitive interface that prioritizes simplicity. Its design makes it easy for non-technical users to navigate and start exploring data with minimal training.
Common actions like creating a new chart or adding a filter are straightforward. For example, Metabase’s “ask a question” GUI lets you build queries by choosing fields and conditions, and no SQL is required.
The learning curve is very gentle, and you can do quite a lot without a dedicated BI developer. The emphasis is on getting to insights fast with a drag-and-drop approach to visualizations and an instantly familiar feel.
Power BI, in contrast, offers a more feature-rich interface with many more buttons, panes, and options. In other words, more advanced features but also, more complexity.
Most users create reports using Power BI Desktop, a Windows application with a ribbon toolbar and multiple panels (for data fields, visuals, filters, etc.). The interface is fairly modern, and if you’re coming from Excel or other Microsoft tools, you'll see many similar elements.
However, new users often need some time to learn how to add data, build relationships, and use the myriad of visualization options. You have access to many robust features for in depth analysis and visualization, but mastering them can take weeks at a time.
You can use Microsoft's extensive support network to get going, or simply hire a Power BI developer as they're not hard to find.
Customizability and advanced features in the UI
Power BI tends to have the upper hand when customizing the user experience and accommodating advanced use cases. However, every advanced functionality has a trade-off; you need time to master it.
In Power BI Desktop, users can define custom calculations using DAX (Data Analysis Expressions) and shape data with Power Query—powerful features for data analysts who need to manipulate data within the BI tool.
Metabase focuses on the basics of querying and visualizing rather than advanced data modeling. You can write SQL queries in Metabase’s editor or use the GUI to join tables, but it doesn’t have an equivalent to Power BI’s full modeling environment or formula language.
While user-friendly, formatting options in Metabase are pretty limited. For example, you might change colors or toggle chart labels, but you won’t find as many fine-grained properties to adjust as in Power BI.
Collaboration and sharing experiences are also different. Metabase’s UI is built for the web, so sharing a dashboard is as simple as sending a link or inviting a teammate into the app. Dashboards in Metabase can be organized into collections and are immediately multi-user (since it’s on a server).
Power BI’s experience involves publishing from Desktop to the Power BI Service (the cloud platform) to share with others. Within the Power BI Service, users get a web interface to view and interact with reports.
Power BI has advanced collaboration features. It allows commenting and annotating and integrates with Microsoft Teams and SharePoint for collaboration. However, to a new user, the need to use both the Desktop and the web service might feel like extra steps.
Data visualization capabilities
Both Metabase and Power BI enable users to create charts, reports, and dashboards, but they are anything but similar.
Visualization options and chart types
Metabase covers all the basic visualization needs for standard dashboards. It supports various common chart types, such as bar graphs, line charts, pie charts, tables, scatter plots, and maps.
These are usually enough to represent key metrics and trends. The interface for creating visuals is very straightforward—you pick a chart type and assign data to the X/Y axes or categories.
However, Metabase’s visualization library is not as extensive as Power BI’s; it focuses on the essentials and may not have certain advanced chart types, such as funnel charts or decomposition trees.
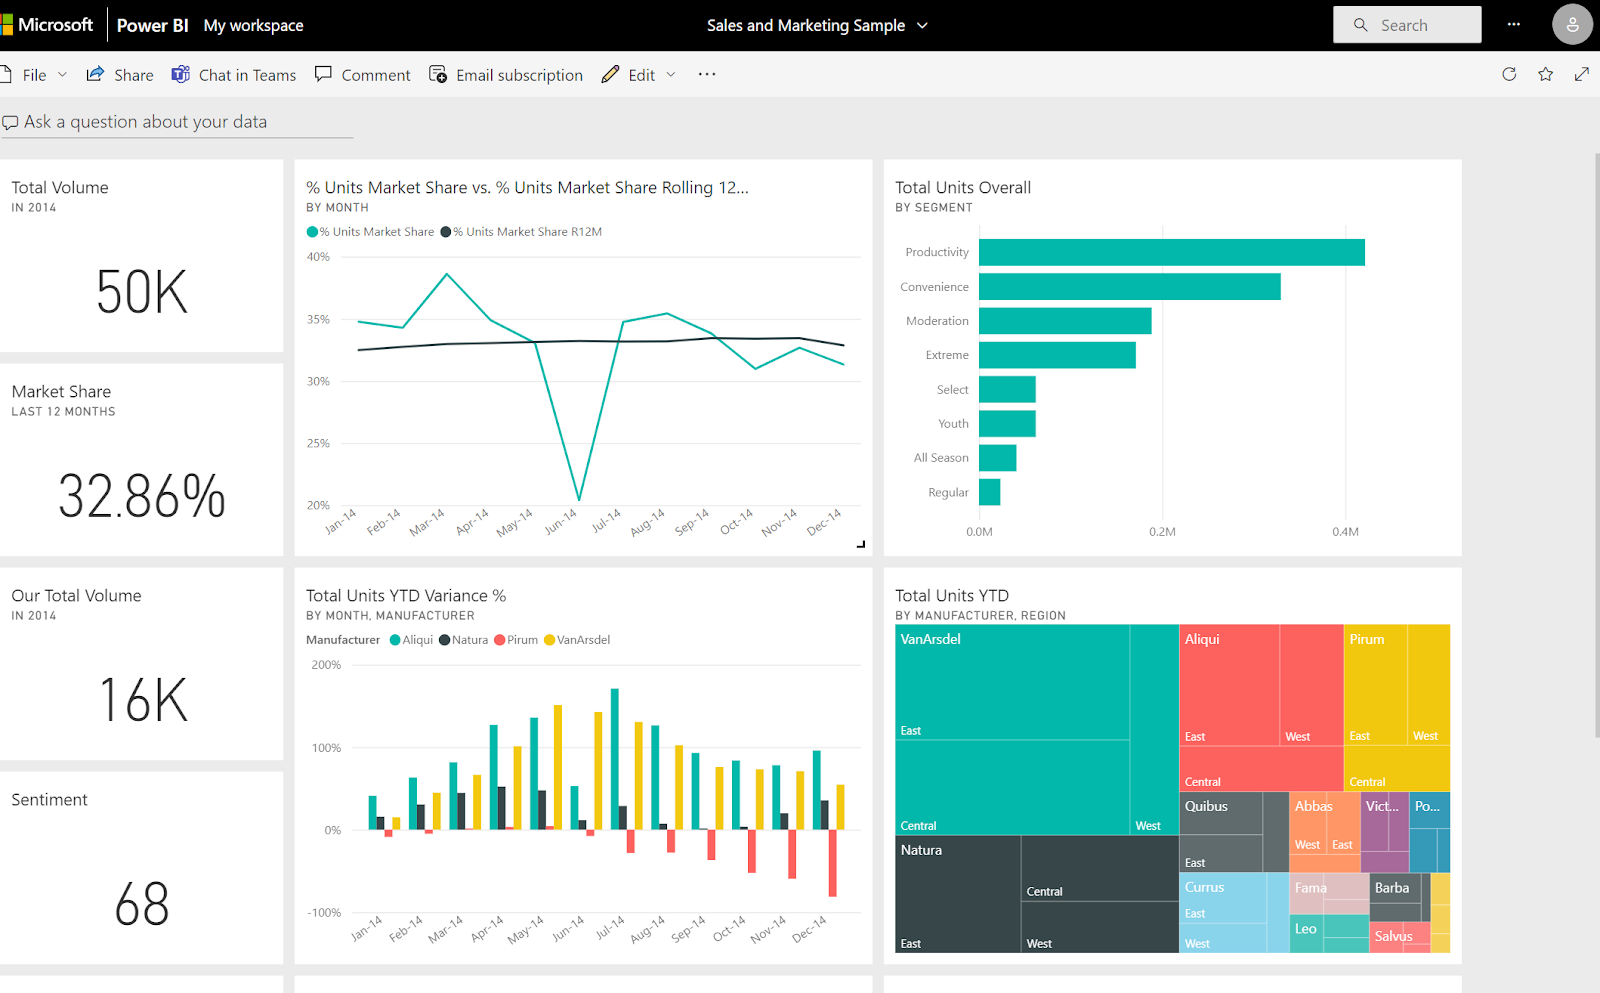
One of Power BI’s strongest selling points is its visualization capabilities. Out of the box, Power BI offers over 100 different chart types and visuals. This includes everything from standard bar/line charts to specialty visuals like treemaps, waterfalls, gauges, KPIs, and geographical maps.
It also supports custom visuals: users can import visuals from Microsoft’s AppSource marketplace or even create their own. This means if you need a niche chart (say, a heatmap calendar or a network diagram), chances are there is a Power BI custom visual available for it.
Additionally, Power BI integrates R and Python for visuals, so advanced users can script custom charts using those languages and embed them directly.
Interactivity and drill-down features
Modern BI tools offer interactivity in dashboards, allowing users to slice and dice data on the fly. Metabase and Power BI support interactivity, but the extent varies.
In Metabase, interactivity comes in dashboard filters and some light drill-down abilities. You can add filters (like date range pickers or dropdowns for categories) to a dashboard, which can simultaneously filter multiple cards (charts).
The interactivity is generally simple – enough to let product managers or team leads answer common follow-up questions (like “show me this month vs last month” via a date filter). However, it doesn’t offer deep multi-level drill-down by default. You might not be able to click on a bar in a chart and automatically break it down by a sub-category (unless you pre-configure a separate view or use SQL).
Power BI is known for its rich interactive features. By default, visuals are interconnected in any Power BI report: clicking a data point in one chart can highlight or filter related data in other charts on the page.
Power BI also natively supports drill-down and drill-through actions. You can create a hierarchy (e.g., Year > Quarter > Month > Day) and enable drill-down so that users can double-click a year column to see quarters, and so on.
Another aspect is real-time and streaming data: Thanks to its integration with streaming datasets, Power BI can handle real-time dashboards with streaming tiles (for example, showing up-to-the-minute sensor data or live Twitter feeds).
Metabase typically works on your database's query results and doesn’t natively specialize in real-time streaming visuals (though it can auto-refresh on a schedule).
Metabase vs Power BI pricing
The major difference between the cost of Metabase and Power BI is that you can actually use Metabase for free, in its open source tool version. On the other hand, Power BI requires purchasing different license types to have the basic functionalities.
Here is how the pricing models are different.
Metabase pricing
You can learn more about Metabase pricing in a separate post on our blog, so we'll cover the basics this time around.
One of the biggest advantages of Metabase is its open-source core, which is free to use.
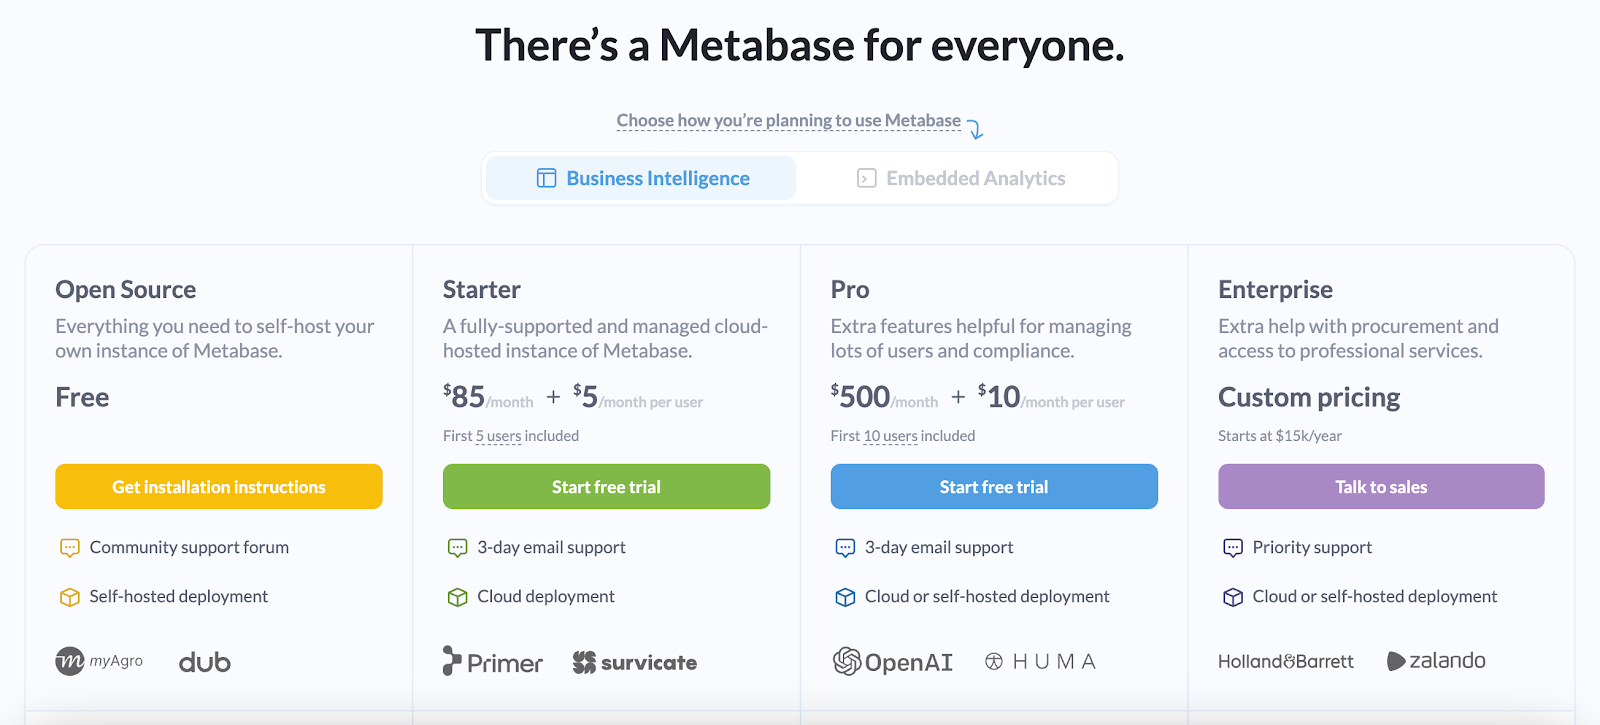
You can download Metabase, deploy it on your own server (or cloud platform), and have a fully functioning BI solution without paying any license fees.
Metabase offers paid plans mainly for their hosted cloud service and enterprise features. According to Metabase’s pricing, the Pro plan starts at around $500 monthly for up to 10 users.
This Pro or Enterprise edition includes additional capabilities that larger organizations might need: for example, official support channels, advanced admin controls, SAML/SSO integration, auditing, and sometimes features like data sandboxing or caching improvements.
Metabase’s pricing doesn’t scale per se by data volume, only by user count and feature set, which can be positive or negative, depending on your use case.
Power BI pricing
Microsoft’s Power BI uses a subscription-based pricing model with a mix of per-user and capacity licensing. The main tiers are Power BI Free, Power BI Pro, and Power BI Premium (which has sub-modes of per-user or per-capacity).
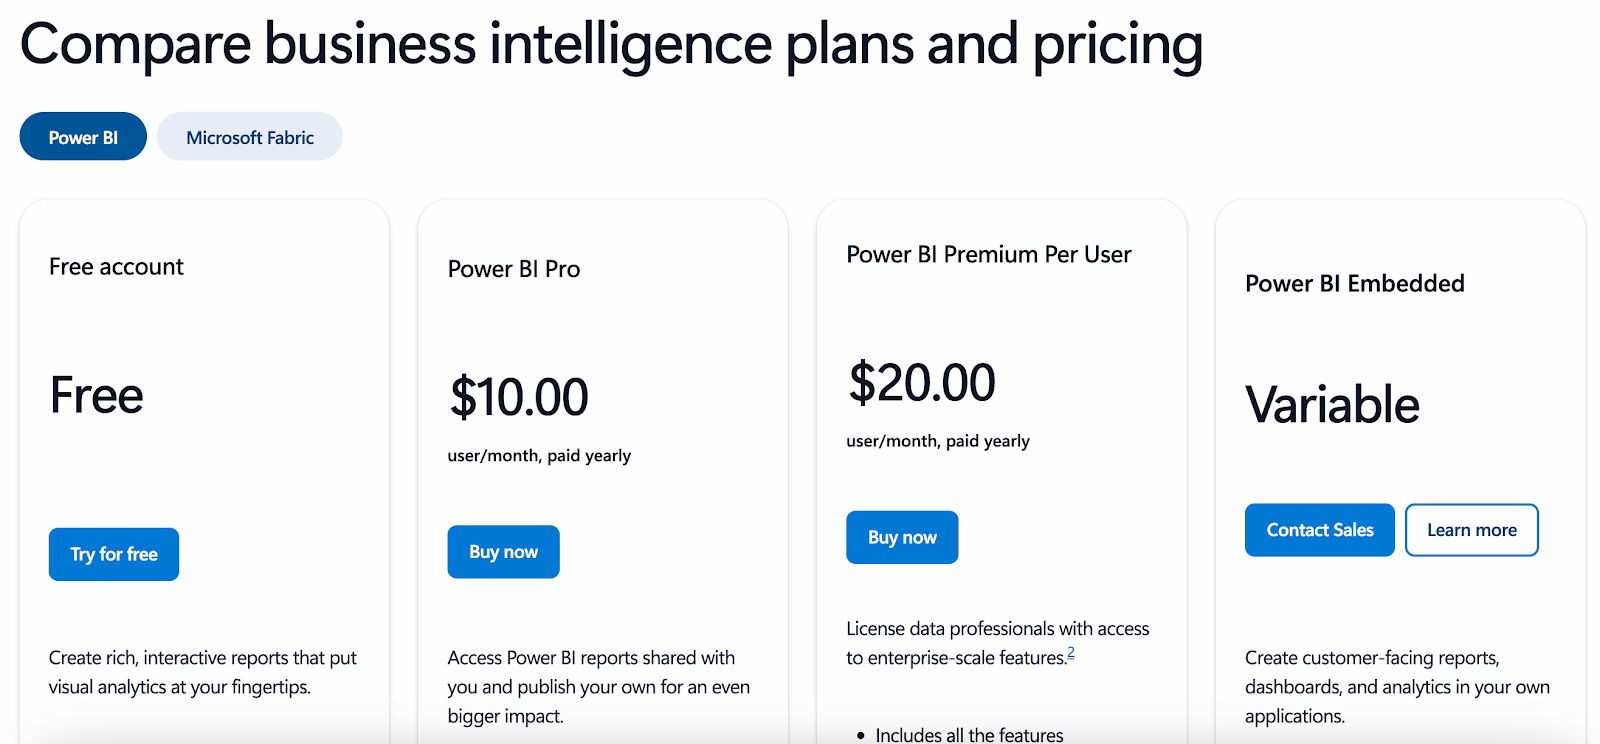
- Power BI Desktop is free for anyone to download. You can create reports at no cost. However, the free tier has limitations regarding sharing: you can only publish reports to the Power BI Service for your own use, and you cannot share reports with others unless you purchase a Pro license.
- Power BI Pro is the most common business subscription. It costs about $10 USD per user per month.
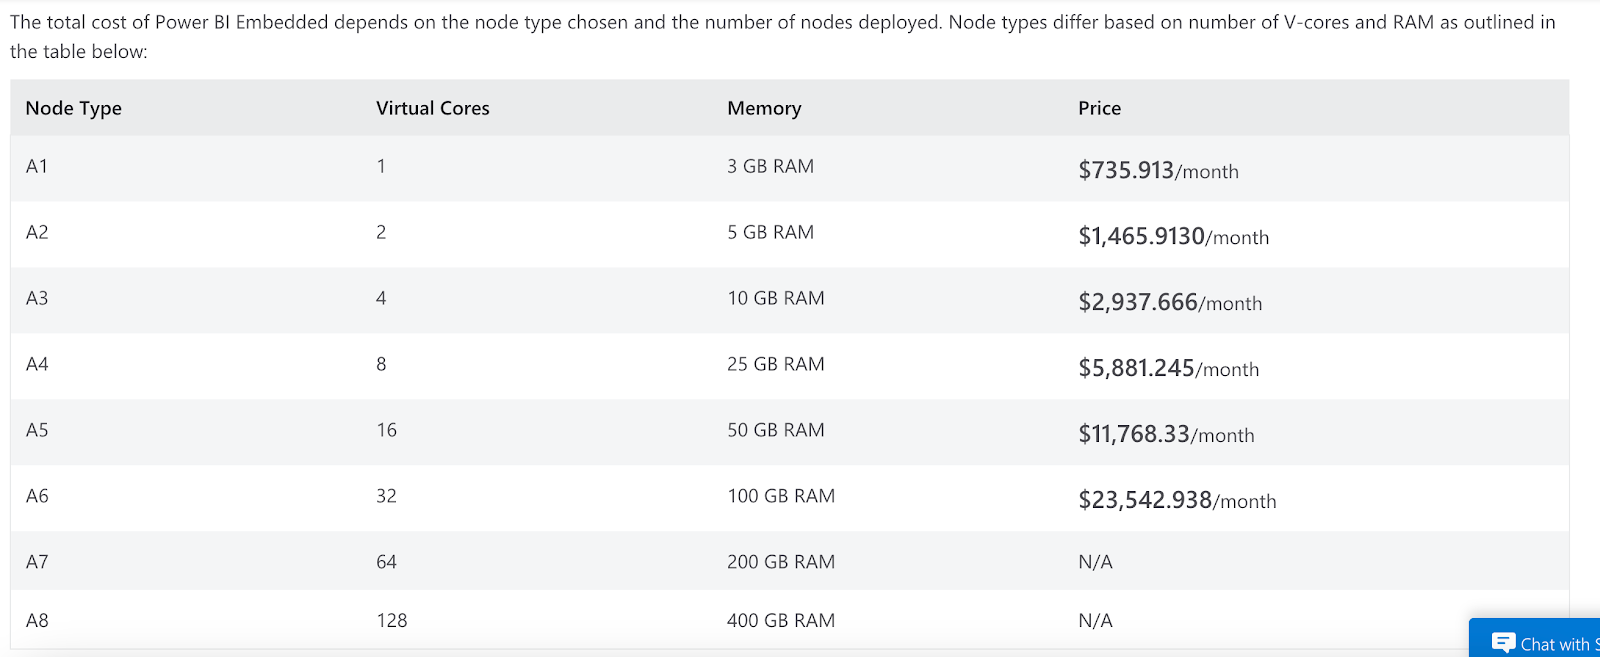
A Pro license allows users to publish reports to the cloud, share dashboards, and collaborate with other Pro users. Essentially, if you want internal colleagues to view or interact with your reports on the Power BI Service, each of them needs a Pro license. - Power BI Premium comes in two flavors: Premium Per User (PPU) and Premium Capacity. Premium Per User is relatively new and costs about $20 per user/month, offering some of the advanced features of Premium (like larger dataset sizes, AI features, paginated reports) individually. Premium Capacity is an organizational license where you buy a certain capacity (measured in virtual cores). Premium is needed for heavy usage scenarios, such as distributing content broadly without each consumer needing a Pro license, or for embedding Power BI in custom applications for external users. Premium (capacity) is significantly more expensive – it’s measured in the hundreds to thousands of dollars per month range, depending on capacity. For instance, a basic Power BI Embedded A1 capacity starts around $700-$800 per month for continuous 24/7 usage.
The idea is that with capacity, you can have unlimited viewers (like customers of your app) without paying per user, as long as your capacity can handle the load. Large enterprises might go for Premium capacities (P SKUs) that can cost $5k+ per month, but that supports a whole company’s BI workload.
Pricing summed up
To put it simply: Power BI is cheaper initially on a per-user basis, but if you need wide distribution (like embedded analytics to many customers or sharing reports with the whole company), you have to invest in Premium, which is a more significant fixed cost.
Metabase is free for unlimited users if self-hosted, but you’re on your own for support (or pay Metabase for their hosted service, which has its own costs as noted).
Depending on your scenario, a small tech startup might find Metabase’s free model unbeatable. In contrast, a mid-sized company already using Microsoft might happily pay $10/user for Pro to get the seamless integration and support with Power BI.
However, if you need embedded analytics, the pricing models can scale poorly and leave you with a large monthly bill—neither tool is really built for this use case, and other options may be a better fit.
Embedded analytics capabilities
Both Metabase and Power BI support embedded analytics, but they do so in different ways and with different levels of complexity and cost. It is a core offer of Metabase, while for Power BI it is more of an option that is nice to have.
It’s important to note in advance that Metabase and Power BI are not embedded analytics tools. They are internal BI tools, with the ability to embed the dashboards elsewhere with an iframe. They are often lamented for their slow loading, and ultimately, these tools will feel like a BI tool embedded in your application, not like an integrated part of your app. In many cases, a dedicated embedded analytics tool would be more suited.
Metabase embedded analytics
Although it has an opinionated UI, Metabase dashboards can be embedded into your application. There are essentially two modes to embed Metabase charts/dashboards into another application: public embedding via standard iframe and secure embedding via signed tokens (often used with the Metabase API or SDK).
- Public/iframe Embedding: Metabase allows you to generate a public share link for a dashboard or chart. This link can be used in an <iframe> to embed the visualization in another webpage. Public embeds are quick to set up (just copy-paste an iframe code) but are intended for non-sensitive data, since anyone with the link could view it.
- Interactive embedding with tokens/SDK: For customer-facing or internal applications where you need security and per-user filtering, Metabase offers an embedding SDK (e.g., a React component library) and a way to embed with signed JWT tokens. However, even with an SDK, Metabase still uses iframes.
In other words, the SDK or JWT token doesn't eliminate the iframe itself—it securely controls the content displayed inside the iframe, ensuring data security and user-specific content, while still using iframe as the primary embedding method.
From a developer’s perspective, Metabase embedding is relatively straightforward: you configure a few settings on your Metabase instance (enable embedding and set a secret key), then use either an iframe or their API to fetch an embed link with a token. If you use the open-source edition, you might implement embedding with a bit more manual effort and without official support, but it’s doable.
One thing to keep in mind is that with Metabase embedding, you are hosting the BI infrastructure (unless you use Metabase’s own cloud). So performance and scaling is your responsibility – for just a few embedded users this is trivial. However, if thousands of concurrent users are suddenly viewing embedded dashboards, you’d need to ensure your Metabase instance and database can handle it.
Power BI embedded analytics
Power BI’s embedding capabilities are powerful but come with some complexity, as it is a more enterprise-focused solution. Microsoft offers Power BI Embedded as a specific service for developers who want to embed visuals into applications. Essentially, there are a few scenarios:
- Internal embedding: If you just want to embed a Power BI report for internal users (within your organization), you can actually do so with Power BI Pro licenses – for example, using the Power BI Service, you can generate an embed code for internal SharePoint pages or Teams, etc. Internal users would still need to authenticate (and have Pro licenses).
- Public embed (Publish to Web): Power BI has a very easy “Publish to web” option which gives an iframe snippet. But Publish to Web is completely public and not secure – it’s similar to posting your report publicly on the internet for anyone to view. This is only suitable for public data or demos.
- Power BI Embedded (for ISVs/external users): This is the main way to embed dashboards and reports into a custom application for your customers or a wider audience without requiring each person to have a Power BI account. Power BI Embedded is essentially an Azure service that provides capacity for rendering Power BI reports in your app via an iframe.
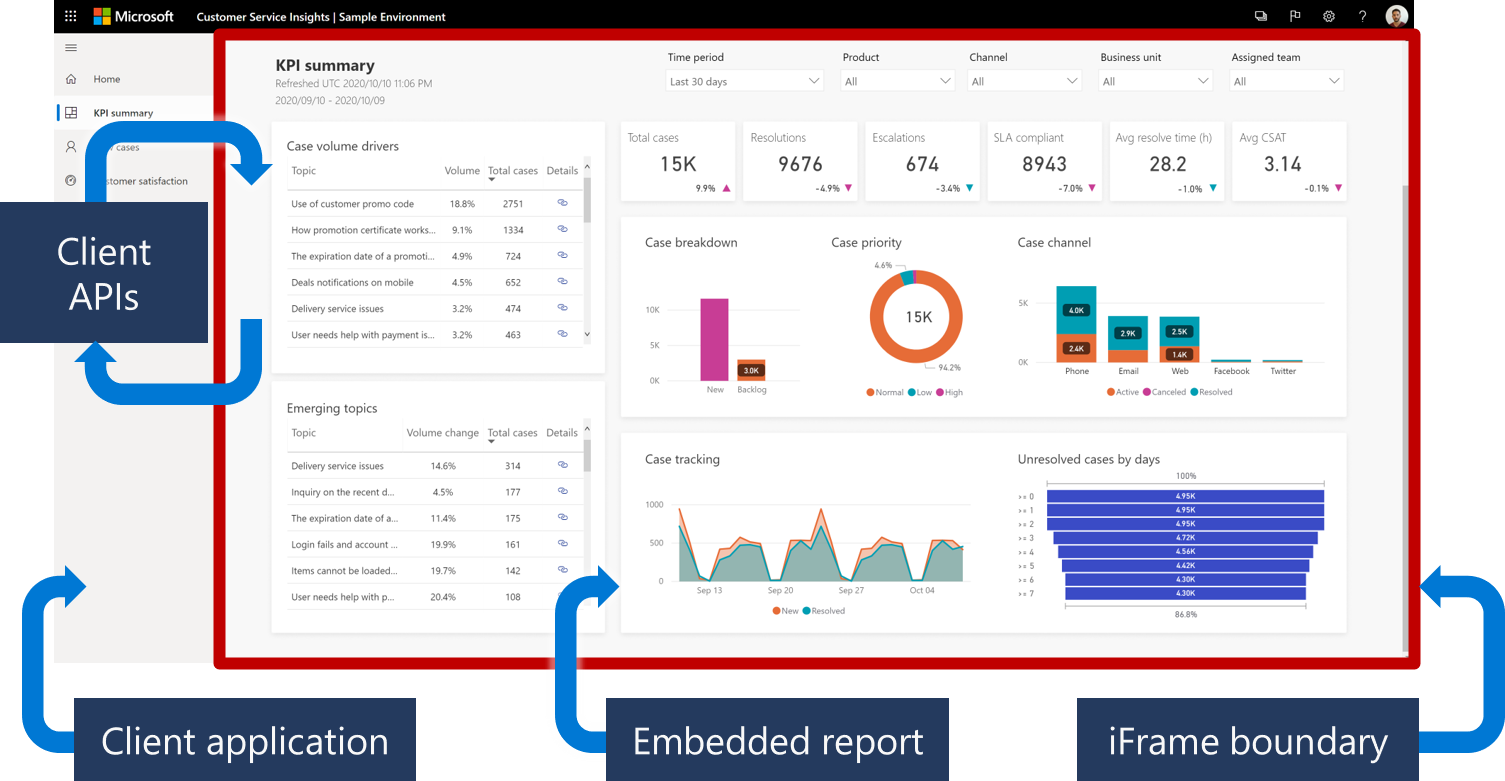
From a capability standpoint, Power BI Embedded allows your embedded reports to have all the interactive functionality that normal Power BI reports do. You can also control things like enabling or disabling certain toolbar options on the embedded report (for example, you might hide the “Edit” button for end users).
Critically, Power BI embedded respects whatever roles and row-level security you defined in the report. You can programmatically assign which user identity or role the embedded view should run as, thereby showing, for instance, customer A only their data.
However, all this flexibility comes with complexity and cost. To do a proper external embed, you typically need at least a Power BI Embedded capacity. As mentioned earlier, that starts around several hundred dollars per month.
Microsoft’s documentation and community are rich around Power BI embedding, but it’s fair to say it’s a developer-heavy task to set up initially. A developer might take a few weeks to learn the ropes of Azure AD app registrations, service principals, and embedding APIs to get everything running smoothly.
The verdict on embedded analytics
You’re likely better served with a dedicated embedded analytics tool - as they are purpose-built for the specific needs of an embedded use case, and not just a BI tool wrapped in an iframe. However, if speed of loading and a native-feeling experience are not important to you, then both tools may still be an option.
Metabase embedded analytics is about simplicity and control, letting you integrate basic analytics quickly and cheaply, whereas Power BI embedded is about a full-featured analytics experience with the backing of Microsoft’s platform, suitable for larger scale deployments with strict requirements.
Metabase gives startups and developers a quick, cost-effective toolkit to embed charts with full control over deployment. Power BI provides a path to embed enterprise-grade BI, ideal when you already have Power BI expertise or need the assurance of Microsoft’s infrastructure for serving potentially large audiences with advanced analytics.
The final choice boils down to your previous experience. If you already use Power BI internally, you could get past the embedding complexities and use it for an embedded use case too. However, if you're looking to build out embedded analytics from scratch, Metabase is more flexible, affordable and easier to embed.
Which one should you choose?
Choosing between these business intelligence tools boils down to your individual needs and budget. Both can be an excellent choice, but at the same time, either can make life unnecessarily complex for your team and users.
Choose Metabase if…
Metabase is an excellent choice if you're a startup, SMB, or small tech team seeking quick deployment, simplicity, and affordability because of its free version. With its intuitive interface and minimal setup, you can rapidly embed analytics into your product without the complexity or cost of enterprise solutions. Choose Metabase if:
- You want a low-cost, open-source solution with no per-user licensing, ideal for embedding dashboards into customer-facing apps on a budget.
- Your team prefers simplicity, quick onboarding, and minimal maintenance overhead. Metabase lets even non-technical users easily create basic dashboards to help them make data driven decisions.
- You value hosting flexibility and full control over your infrastructure. You can self-host Metabase on your own servers or cloud, avoiding vendor lock-in.
- Your primary needs include standard SQL-driven visualizations, simple interactive filters, and straightforward user permissions, rather than advanced analytics or extensive integrations.
Choose Power BI if…
Power BI is the ideal solution for organizations with advanced analytics needs, extensive data integrations, or existing investment in Microsoft's ecosystem. With powerful data modeling and interactive dashboards, it suits complex, enterprise-grade scenarios. Choose Power BI if:
- You require robust, enterprise-level analytics features, including advanced data analysis and visuals, complex data modeling (DAX), real-time reporting, and AI-driven insights to help you analyze data easily.
- You're already invested in Microsoft technology (Azure, Office 365), so you can fit Power BI in your existing workflows and user management.
- You need sophisticated analytics at scale, backed by enterprise-grade security and scalability.
- Your team is comfortable investing time in mastering Power BI’s extensive capabilities and steeper learning curve. Your budget can also accommodate licensing or premium capacity costs for broad deployment.
The best choice if you need embedded analytics
Embedding a traditional BI tool like Power BI or Metabase in your application has many drawbacks because those tools were built for internal analytics, where speed of loading and having control over the UX and UI are not important.
If you need something that loads fast, and looks like it’s genuinely part of your application then you should consider a dedicated embedded analytics tool. Embeddable is the only tool that allows you full control, in code, so you can apply your own design system and extend it infinitely.
Unlike general-purpose BI tools, Embeddable prioritizes a developer-friendly experience, with flexible customization, easy integration with various data sources, and minimal maintenance.
Embeddable has a simplified approach to embedding analytics directly into your product's, and is built with the needs of product and engineering teams in mind; which is making developers fall in love with it.
You can quickly integrate interactive dashboards that match your product branding, without the costs of building it yourself, and without the pitfalls of using a tool like Metabase or Power BI that weren't built for the job.
Don't take our word for it - sign up to get started with Embeddable today.
Frequently asked questions
1. Which is better for embedded analytics: Metabase or Power BI?
Metabase is easier to embed and has an open-source version, while Power BI is more powerful but complex to integrate. The better choice depends on your need for flexibility vs. advanced enterprise features. However, you may want to consider a purpose-built embedded analytics tool vs. a general-purpose BI tool like Metabase or Power BI.
2. Can Power BI be embedded in a multi-tenant SaaS product?
Yes, but it requires setting up complex authentication and capacity management. It’s more suited for enterprise IT teams than fast-moving product teams.
3. Is Metabase more developer-friendly than Power BI?
Generally yes. Metabase offers easier embedding and simpler setup for teams that want fast integration without heavy configuration. When it comes to customization options that developers might find valuable, a headless embedded analytics tool like Embeddable may be a better choice than Metabase or Power BI.