What charts are available in Sigma for embedded analytics?
Learn the available visualization types in Sigma and what you can and cannot do when visualizing your data.
Summarize with:
Sigma Computing is a fairly popular business intelligence and analytics platform launched in 2014. Unlike traditional BI tools such as Tableau or Power BI, Sigma combines spreadsheet-like interactivity with visual analytics, making it more accessible to non-technical users. To visualize the underlying data, Sigma gives you a decent number of options.
Whether you’re showing dashboards to your internal team or any number of end-users, you’ll need a good variety of visualization types. Today, we'll show you how you can visualize data in Sigma and how it fares against other popular business intelligence platforms and embedded analytics tools.
Chart and visualization types in Sigma
Sigma includes a solid range of out-of-the-box visualizations for building dashboards, reports, and embedded views. These can be built without writing SQL or JavaScript, which makes them accessible to business users as well as engineers.
Sigma is built for business users and analysts working with cloud data warehouses like Snowflake, BigQuery, or Redshift.
Here are the visualization types you get in Sigma's spreadsheet like interface:
Common charts
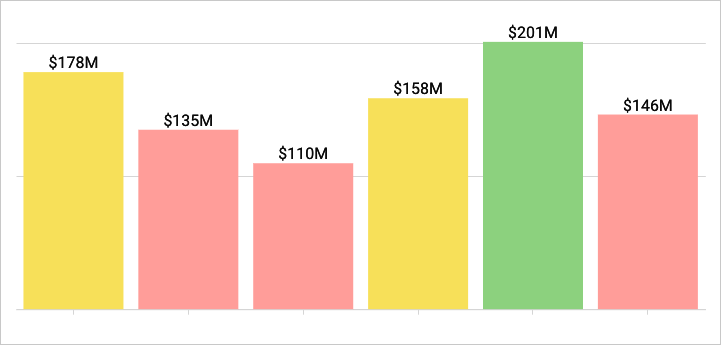
- Bar charts (vertical and horizontal) for comparing categorical data.
- Line and area charts for time series and trend analysis.
- Combo charts combining bars, lines, and areas on a shared axis.
Advanced charts
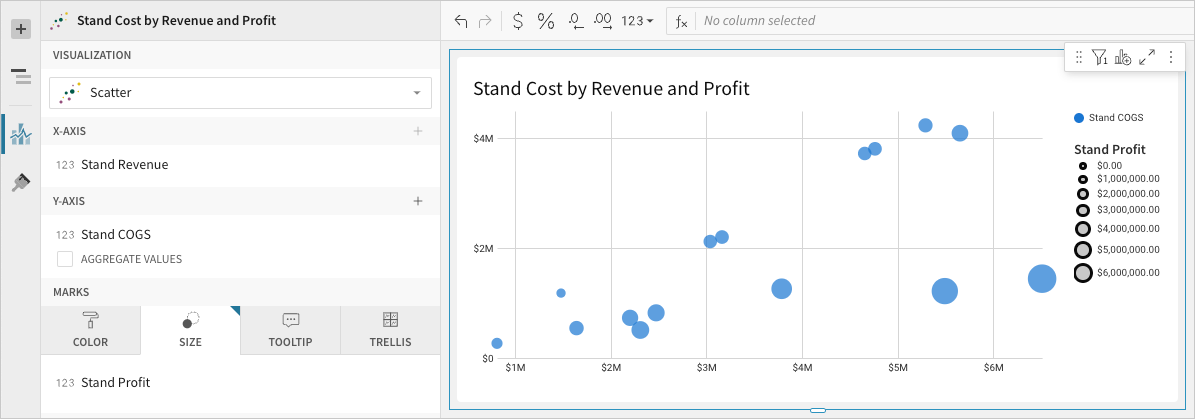
- Scatter plots for comparing two numeric variables and spotting relationships.
- Box plots for statistical data distribution comparisons.
- Waterfall charts to show additive breakdowns (e.g., revenue or margin changes).
- Gauge and KPI charts for single-metric performance indicators.
Funnel and flow diagrams
- Funnel charts to visualize drop-offs in sequential processes like sales pipelines.
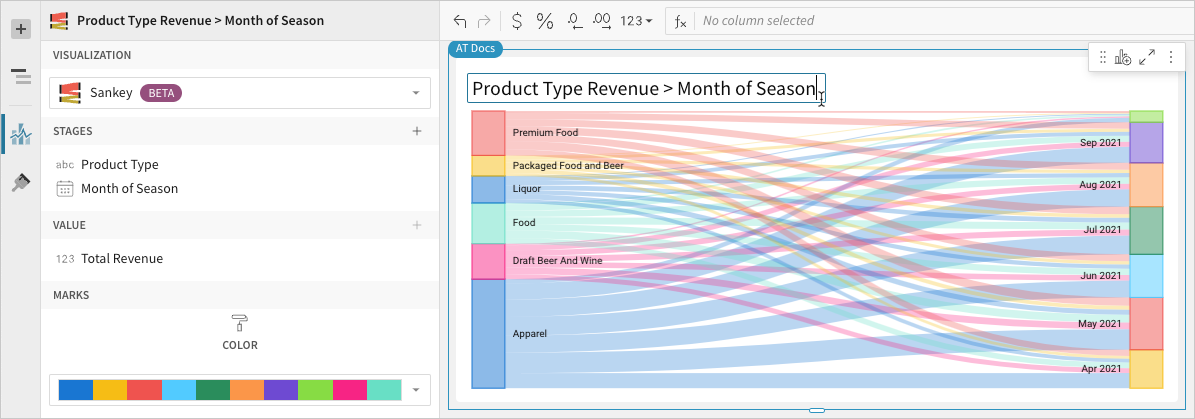
- Sankey diagrams to represent the flow between categories or stages.
Geospatial maps
- Region maps with country, state, or custom area coloring.
- Point maps for plotting lat/long data on map backgrounds.
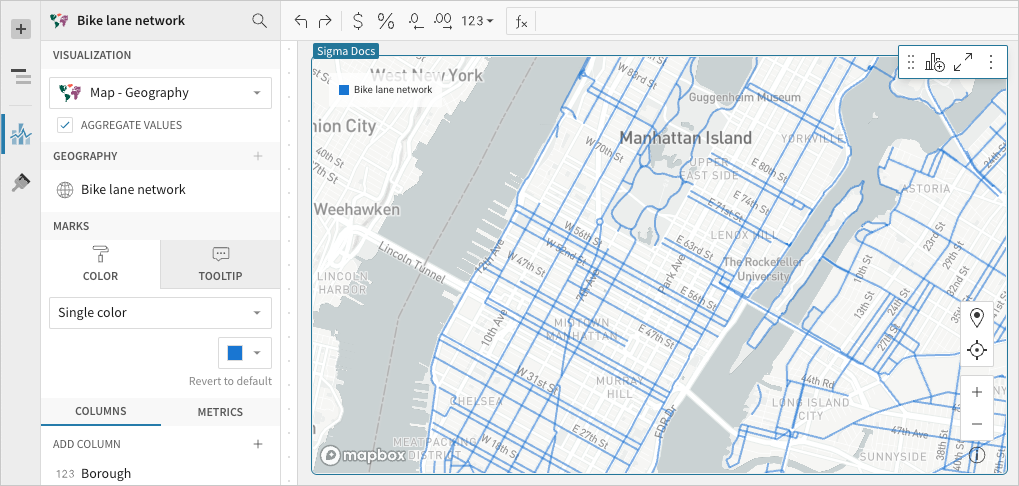
- GeoJSON maps for custom boundary visualizations.
Tables and pivots
- Pivot tables that support aggregations, grouping, and nested breakdowns.
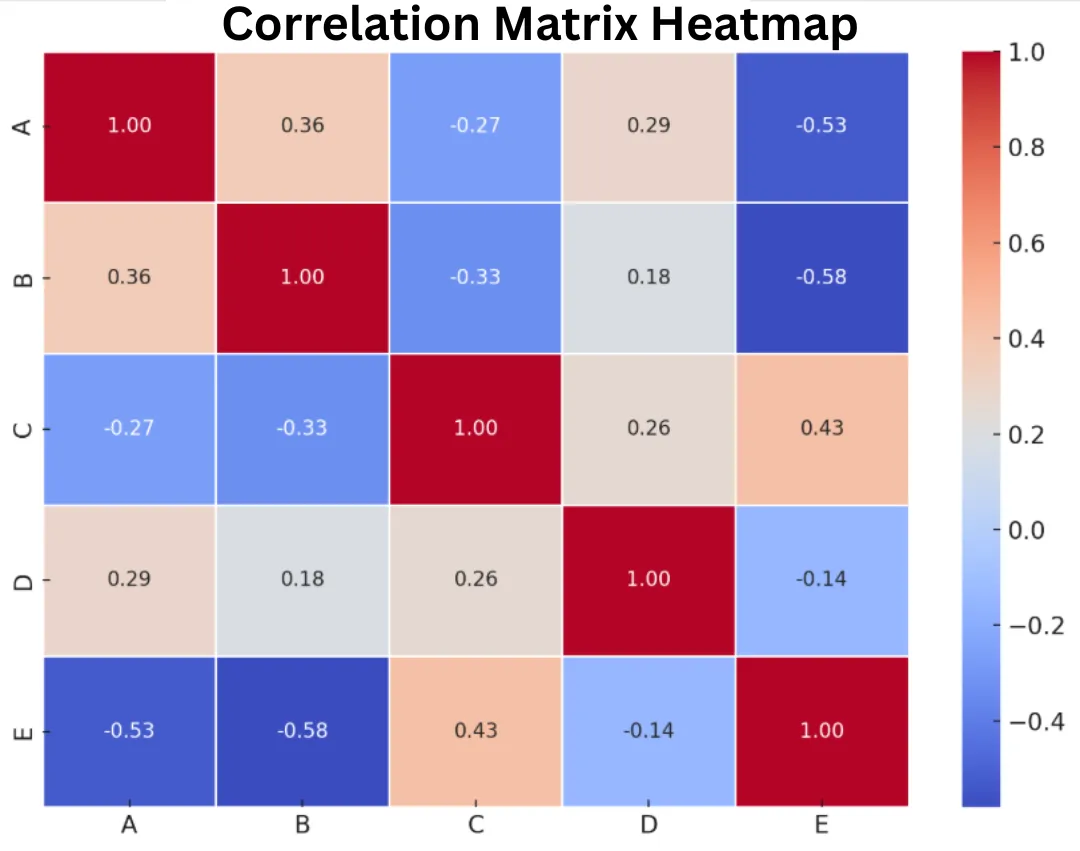
- Heatmaps for high-density matrix views.
- Input tables that allow users to enter or adjust values directly in dashboards (used for what-if analysis).
All of these charts are natively supported inside Sigma’s workbook, drag and drop editor, and each one comes with configuration options for sorting, formatting, axis control, color logic, and reference lines.
You can switch between chart types quickly as you build, and Sigma handles the data aggregation and queries in the background. The end goal is to make data analysis easier and provide end users with valuable insights quickly, through the available visualizations.
Custom visualizations in Sigma: what’s possible and what’s not
Sigma is built to be accessible to business users, so it does not support custom-coded visualizations or direct integration with JavaScript charting libraries like D3.js, Chart.js, or ECharts.
You are limited to the built-in chart types that Sigma provides. Those cover most standard use cases, such as bar charts, line charts, pie charts, scatter plots, maps, pivot tables, and a few advanced types like waterfall or box plots. However, the platform does not allow you to code or embed a custom visualization from scratch, which is why businesses often look for Sigma alternatives.
This means that if your product team needs:
- A radial chart with unconventional logic,
- A multi-layered geographic map,
- A highly interactive chart that doesn’t exist in Sigma (like a custom Gantt view or animated flow map),
- Or even small tweaks like adding custom tooltips, click handlers, or branded chart styles,
Then Sigma is not built to support that. You’d need to find a workaround outside of the platform or shift to a different embedded analytics setup altogether. In other words, you'll need a team of Sigma experts by your side: someone who can tinker with Sigma plugins to get something close to your desired result.
Even themes and formatting options, while useful, are applied within Sigma’s visual boundaries. You can’t reach into the DOM to manipulate the SVGs, canvas, or chart behavior. Sigma’s iframe embed also isolates the visualization layer, so frontend teams can’t hook into the UI for deeper interactions or styling.
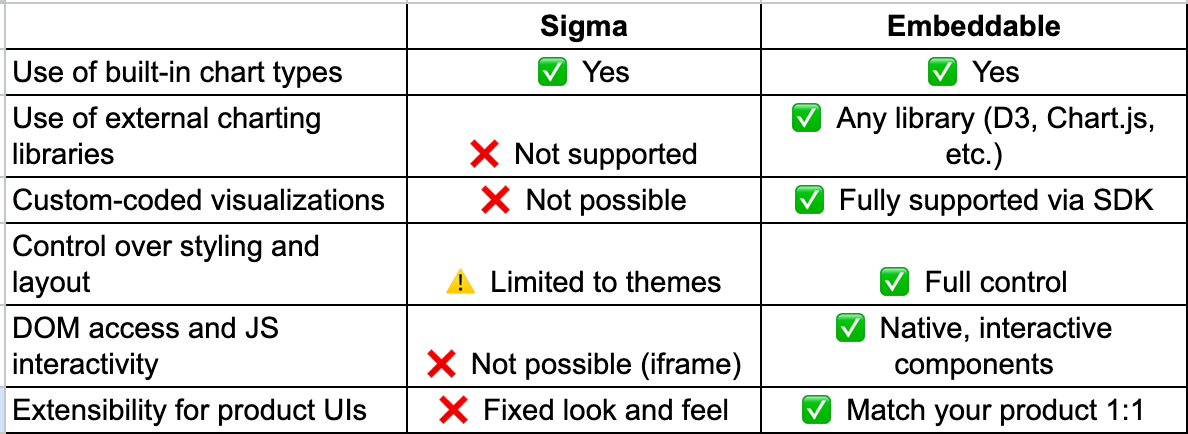
This limitation is a tradeoff for ease of use. Sigma gives you fast deployment, spreadsheet-like data modeling, and interactive dashboards with minimal setup. But it comes at the cost of customization, which is where developer-first platforms like Embeddable come in.
Custom visualizations in Embeddable: full control with any charting library
Instead of locking you into a fixed library of prebuilt charts, Embeddable provides a developer-first, cloud-based environment where you can bring your own chart components, using any frontend library you prefer.
You can build charts in:
- D3.js for complex, data-driven SVGs
- Chart.js or ECharts for out-of-the-box chart components
- Highcharts, Tremor, Google Charts, or any other charting library your team already uses
Once built, you plug these charts into Embeddable using the SDK. From there, they become reusable, dynamic components that work with live data, filters, permissions, and native embedding, but without giving up control over the look, feel, or functionality.
This gives frontend engineers complete freedom over:
- Chart interactivity and animations
- Layout and responsive behavior
- Custom tooltips and interactions
- Styling that perfectly matches your app's design system
- Specialized charts that don't come in other tools
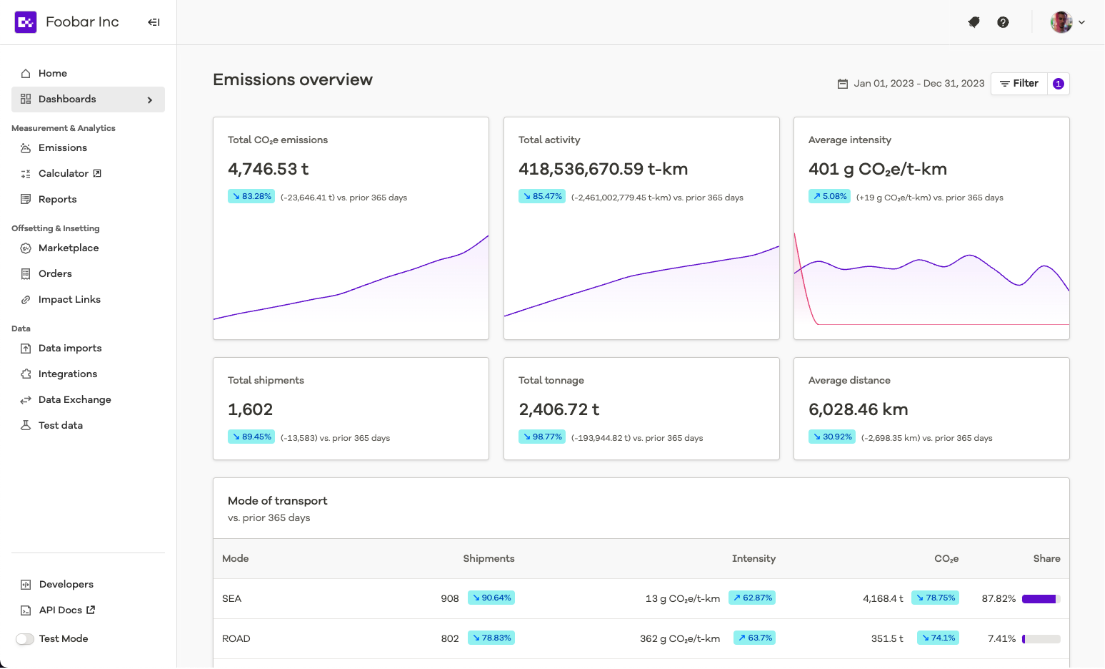
Unlike iframe-based platforms, Embeddable doesn’t impose a wrapper around your visualizations. Everything runs as native components within your app, so you can wire up props, handlers, and callbacks exactly how you want. Business leaders and end users get insights from their data, in a native-looking dashboard.
Wrapping up
Sigma makes it easy to do data management and analysis, with its intuitive interface and a solid number of data sources. But the ease of data manipulation and visualization comes with a hidden cost: a lack of customization. If your primary goal is to enable any user within an organization to create ad hoc reports and dashboards, then it may be acceptable.
However, if you need to create embedded dashboards that have the native look and feel of your product, Sigma will always be out of place. With Embeddable, the only limit is your imagination and the skills of your engineering team.
Frequently asked questions
Can I build my own visualizations in Sigma using D3.js or Chart.js?
Not exactly. You cannot embed custom chart libraries directly as native visuals. However, Sigma does support custom plugins. Developers can build iframe‑based plugins using JavaScript or React that pull data from Sigma and render it using libraries like D3 or Recharts . These plugins function within workbooks, not natively within dashboards, and require developer work.
Is Sigma’s embedding limited to basic iframes?
Sigma supports both public and secure embedding. Secure embedding uses signed, one-time-use URLs generated server‑side (via embed API), allowing control over roles, access, and filters. You can't directly access Sigma's DOM, but you can interact programmatically using Sigma’s JavaScript Embed API for event handling and filter updates.
Are input tables usable in embedded dashboards?
Input tables are available during Explore Mode in web-based workbooks. However, they cannot be embedded inside dashboards via iframe. They’re useful inside the Sigma interface but don’t carry forward into embedded views.