.jpg)


Looker and ThoughtSpot are well-known general-purpose BI tools that also give you the option to embed for your customers in your application.
In this article, we will go through the main considerations for choosing a tool and how this applies to both the internal BI and customer-facing / embedded use cases.
The main considerations we will cover are:
- Visualization options
- Customisation
- Integrations & compatibility
- Performance/loading speeds
- Pricing
- Embedding into your application
Today, we help you choose the better platform for your internal reporting needs and give you a stronger alternative for embedded use cases.
Data visualization capabilities
To visualize different types of data and achieve certain goals with your target audience, you’ll need a variety of charting options. We’ll cover the range of visualizations offered in both tools and how they can help with internal/embedded reporting.
For internal business intelligence
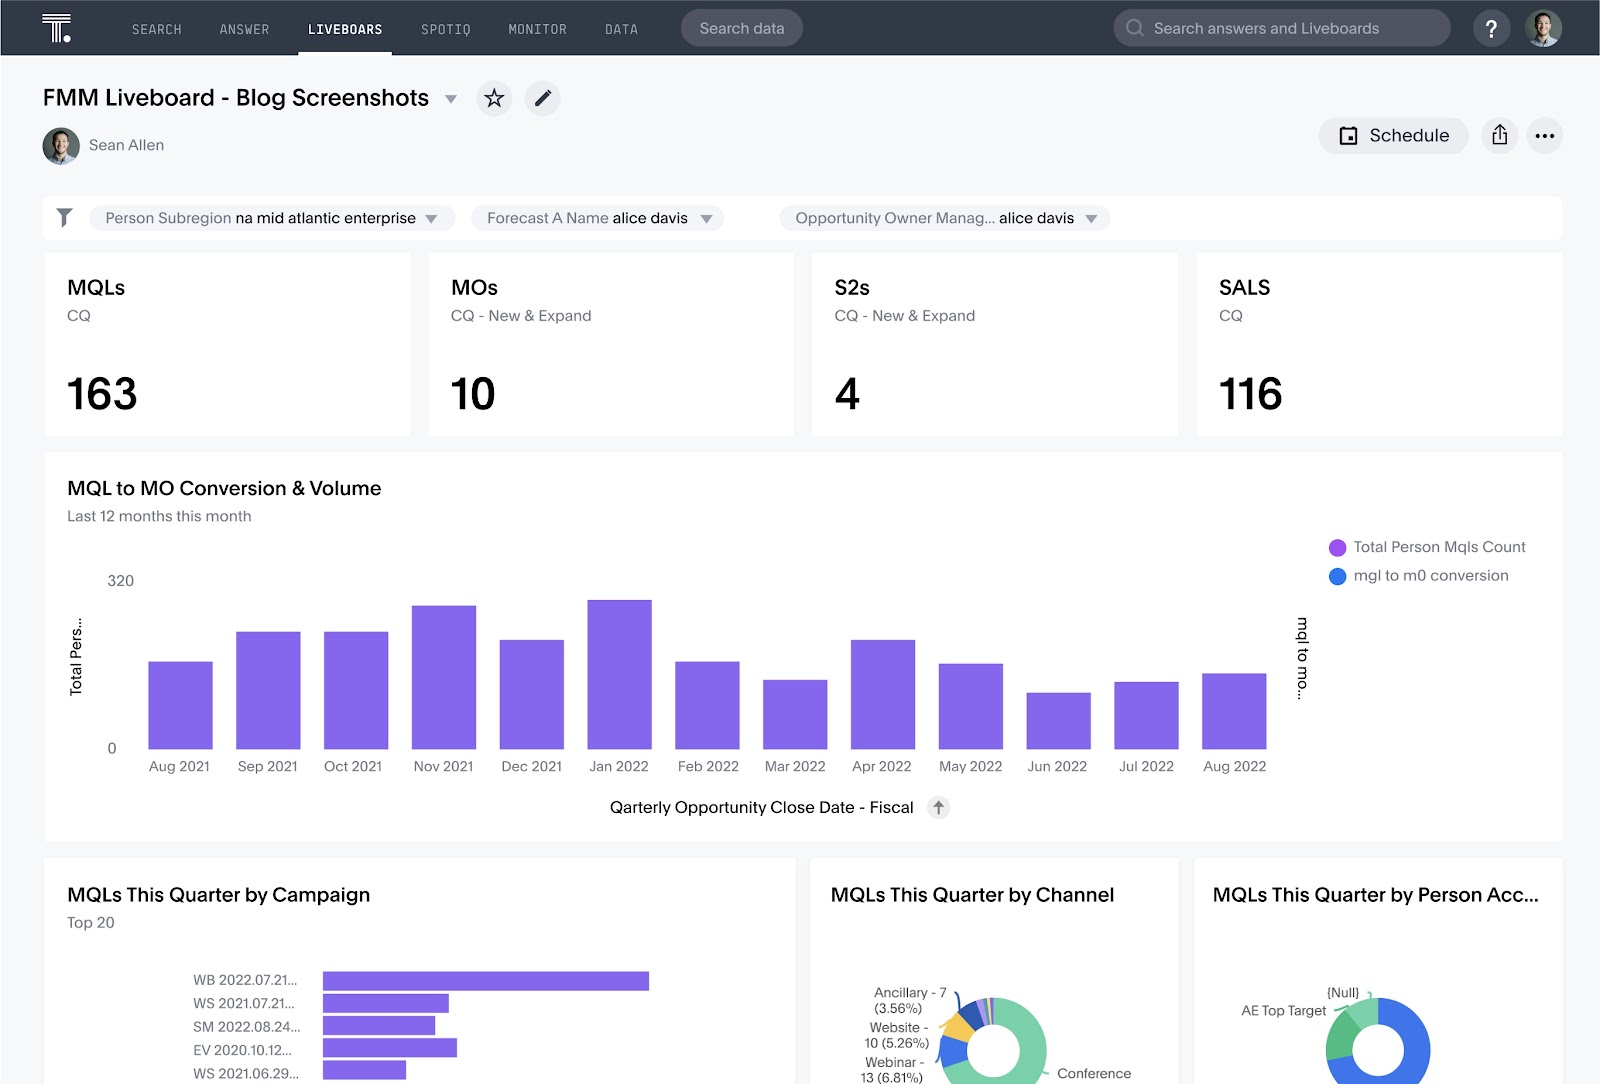
Both platforms offer rich visualization libraries, but with different emphases. ThoughtSpot includes a solid range of charts (from traditional graphs and histograms to word clouds) that are more than enough for a user-friendly interface.
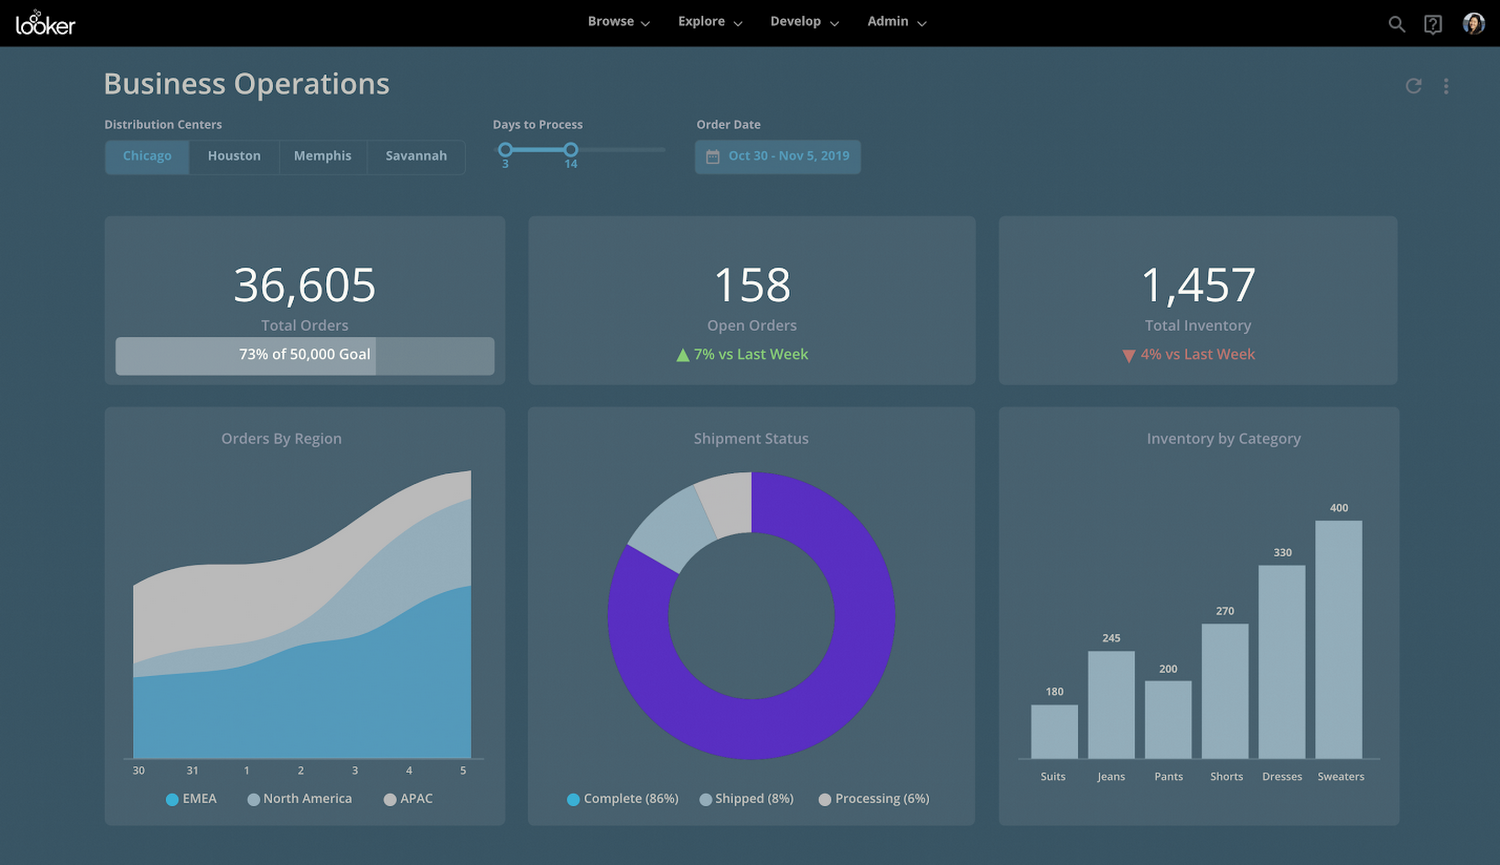
Looker provides an extensive selection of visualizations (comparable to Tableau) with deep customization. Looker comes with many customization options, allowing analysts to drill down and adjust dashboards for easier data discovery. This makes Looker very powerful for data exploration and storytelling, especially for more technical teams.
ThoughtSpot’s visuals are good enough for quick insights, but less flexible than Looker’s, especially if you want to design custom UI elements. Both can deliver actionable insights, but Looker’s strength is in its highly configurable charting and interactive dashboards. In contrast, ThoughtSpot is easy to use but comes with a more limited set of drillable charts
Both tools have sufficient visualization capabilities to perform well in internal reporting use cases.
For embedded, customer-facing applications
For customer-facing analytics (and especially self-service scenarios), your customers may require additional visualization types compared to someone doing a simple monthly or quarterly review.
For example, they may need a word cloud option or the ability to track project progress with a Gantt chart. In this regard, Looker is the better option because it has a vastly superior database of visualizations.
For embedded use cases, your end-users might feel limited by the range of chart types in ThoughtSpot. Looker is the better choice here.
Embedded analytics capabilities
Both tools are primarily built as internal reporting platforms that allow team members to generate and share dashboards. Over time, they added embedded analytics capabilities, allowing users to embed Looker and ThoughtSpot dashboards in a product or a website and share data with end users of an app.
However, user feedback shows that neither is the ideal tool for the job. The reason is simple: they are primarily tools for internal reporting and data analysis, rather than purpose-built platforms for embedding.
ThoughtSpot’s embedded dashboards are technically easy to set up (a few lines of code), but in practice, many users find them clunky and fragile.
ThoughtSpot’s embedded UI often breaks, with zooming and filtering that feel unintuitive. Looker’s embedded analytics require even more work: you must be familiar with LookML to build and embed a dashboard, and its traditional BI focus means dashboards can be slow to load in a customer-facing application.
Instead of making a compromise, you can try Embeddable. Our platform is built specifically for customer-facing embedding. With a headless architecture and lightweight code snippets instead of heavy iframes, Embeddable gives your end users real-time data insights with a sleek UX that matches your product.
Embeddable embeds in minutes, loads in milliseconds, delivering lightning-fast, native-feeling dashboards. Its caching layers ensure sub-second response times, avoiding the lag that plagues Looker and ThoughtSpot’s embedded views.
This means your end users get real-time, branded analytics without the confusion or lag that those other tools can cause.
Book an Embeddable demo to learn more
Customization options
Customization options are important to give you the flexibility to display data in a way that clearly communicates its value to the data consumer. It is even more important when embedding charts and dashboards in a customer-facing application, where you’ll want to make sure that they feel like part of your application.
We’ll cover how Looker and ThoughtSpot perform in both settings separately.
For internal business intelligence
Internal stakeholders typically value accuracy over presentation, and there is no need for style, font, or color customization as the dashboards are typically viewed in the setting of the BI tool’s web interface.
Both Looker and ThoughtSpot provide a range of charts off the shelf, with a range of customisation options for those charts (like changing colours, adding data labels, etc.).
For most internal reporting use cases, both platforms will have most of the common charts and enable a degree of customization that should allow you to present data in a clear way to internal teammates.
For embedded, customer-facing applications
In customer-facing analytics, how much control you have over the look, feel, and functionality is crucial. If you can’t control the visuals in your own application, then:
- Dashboards won’t follow your design system or visual language
- Your users will know that it’s embedded via a third-party tool
- You will be limited in the ways you can display data to your customers.
ThoughtSpot offers very limited customization. In our reviews of ThoughtSpot embedded analytics, we've found that it offers limited customization and flexibility for embedded dashboards. Essentially, you drop in ThoughtSpot’s charts and end up with a third-party look that is hard to rebrand fully.
Looker, which also requires you to embed via iframes, has similar limits. Using Looker dashboards in an app means a less-than-seamless experience with a limited set of fixed components to choose from. There is also a limited set of options to style or customize charts, and no option to extend them. Overall, Looker’s iframe embedded offering means you might slow down your app, and you will struggle to make the UI match your brand.
For embedded systems, both platforms lack deep customization options. The dashboards will look and feel out of place, even with extensive coding.
If you’re looking for a great user experience in your application, then you could benefit from looking at a tool that was built specifically for a customer-facing use case and gives you full control over your UX and UI.
In contrast, Embeddable provides full control over embedded analytics. It is completely white-label and code-first: you build dashboards directly in your own codebase and import your favorite charting libraries (Chart.js, D3, etc.).
You can adjust every UI element to align with your branding. In fact, Embeddable specifically enables customers to build and customize their dashboard views directly within your application.
Because it’s headless, there are no fixed templates or forced iframes, and you truly own the experience. This level of customization means you won’t confuse your users with a generic BI look. Instead, the analytics will feel like a native part of your app.
Integrations and data sources
A robust BI tool must be able to connect to your data. The data in your dashboards has to come from somewhere, and if the BI tool doesn’t come with native integrations, that means more development time for your team trying to figure out a connection with an API.
For internal business intelligence
Having access to ready-made integrations makes a massive difference for internal reporting. Here are just a few benefits:
- A centralized view of business data
- Data freshness, which is crucial for real-time decision making
- Reduced manual labor and fewer errors
- Query performance: You can use optimized queries or live connections, improving speed and reducing the need for duplication or syncing
- Scalability and future-proofing, as you can add more integrations and data sources when you need them at a later point
Both ThoughtSpot and Looker support major cloud data platforms, but Looker has a slight edge in breadth. ThoughtSpot covers leading cloud data warehouses (Amazon Redshift, Databricks, Teradata, etc.) and even business apps like Salesforce, HubSpot, Slack, and Google Sheets.
Looker also has connectors to virtually every common data source, including PostgreSQL, MySQL, Redshift, BigQuery, Snowflake, and more. It even integrates with ETL tools (Fivetran, Stitch) and CRMs (Salesforce, HubSpot) and exposes an API for custom integrations, so your data analytics team can play around and build integrated, scalable analytics engines.
A notable perk of Looker is its native connectivity with Google Cloud (it was acquired by Google), making BigQuery and Sheets connectivity seamless.
Both tools are good options for internal reporting when it comes to integrations, but Looker has a slight edge due to its Google Cloud connectivity.
For embedded, customer-facing applications
The right set of integrations is crucial for embedded analytics. Here are just a few main reasons:
- User-facing data must come from the right sources. If you're embedding analytics into your SaaS app, users expect insights based on their data. Your BI tool must connect easily to your product’s database or API to securely and accurately pull in customer-specific metrics.
- Customization per user or tenant. Embedded dashboards often serve multiple users or clients. Strong data source integration enables dynamic filtering, row-level security, and data isolation, ensuring that each user only sees what they’re authorized to view.
- Performance and latency. For embedded use, slow queries hurt the product experience. Native connections to your data sources, ideally with support for caching or query optimization, are critical to deliver fast-loading dashboards.
- Real-time or near-real-time insights. Your customers want up-to-date information. A BI tool that integrates directly with your operational database or warehouse makes it possible to show fresh data without complex sync jobs.
- Developer efficiency and fewer workarounds. Clean integrations save your team from building data pipelines, maintaining ETL jobs, or transforming data manually. That means faster implementation and less tech debt.
Looker integrates directly with modern cloud data warehouses like BigQuery, Snowflake, Redshift, and Databricks. It queries data in place without importing it, which is helpful for large datasets.
For embedded use, this means dashboards reflect live data without needing duplication. Looker’s data modeling layer (LookML) allows developers to define reusable logic and customize views for each client, which is essential for multi-tenant setups. However, setting up these models can be complex and time-consuming.
ThoughtSpot, on the other hand, offers connectors to cloud warehouses and popular SaaS apps, but typically requires importing data into its internal in-memory engine (Falcon) for optimal performance. This can limit flexibility when dealing with real-time or frequently changing data. While ThoughtSpot has improved its integration breadth, it’s still behind Looker in terms of developer control and embedded architecture.
To sum up, Looker is better suited for embedded use cases that demand flexible, live connections and deep control over data access per tenant. ThoughtSpot may be faster to implement for simpler setups, but it doesn’t have the same depth for complex embedded scenarios.
Use Embeddable is different
Embeddable also connects to all the modern data warehouses and databases. Our integrations include Snowflake, Databricks, BigQuery, Redshift, ClickHouse, MySQL, PostgreSQL, Oracle, Athena, Hive/Spark, and many more.
Embeddable connects securely via read-only transactions, letting you surface any data in your app. In practice, you’ll find Embeddable’s data sources on par with Looker’s – and far beyond Excel – ensuring you can integrate your cloud data stack and deliver timely insights.
Dashboard performance
Today’s business users expect insights as quickly as getting a recommendation for their next Netflix series. Fast-loading dashboards are becoming standard, but it doesn’t hold the same weight in different types of use cases.
For internal business reporting
In cases where users send each other reports or dashboards within one team, dashboard performance may not be critical. You can imagine the typical head of marketing zooming in on the quarterly report with a coffee in their hand. In other words, if the dashboard takes 10 seconds to load, it’s far from a dealbreaker.
ThoughtSpot uses its own in-memory calculation engine (Falcon) for most use cases. It loads data into memory and performs calculations there, which often results in faster performance for high-speed filtering, search, and large datasets. This can make it feel more responsive out of the box, especially for business users running ad hoc queries without predefined dashboards.
Looker relies on your data warehouse for query execution. This means performance depends heavily on how optimized your database is. For large organizations with well-structured data models and fast data warehouses, such as BigQuery or Snowflake, Looker performs well.
However, slower or poorly indexed databases can lead to lag, especially with complex dashboards. Looker doesn’t cache much by default, so repeated queries can re-run unless caching is configured.
In internal use cases, the performance will be acceptable for both tools. Stakeholders are not time-pressed for data, and the occasional few seconds of lag time won’t make a major impact on the user experience.
For embedded, customer-facing applications
In this scenario, performance is vital. Especially when the rest of your app loads in a millisecond, having a dashboard that takes a while to load can be detrimental to your product usage and stickiness.
ThoughtSpot is the better choice in terms of performance, with its query-optimized performance. The caveat is the cost, and for platforms with a large number of users and dashboards, just fetching real-time data can end up costing thousands of dollars every month.
Looker is noticeably slower and shows traces of its internal BI infrastructure. Their embedded dashboards can suffer latency. Looker was built for robust internal BI, not real-time customer apps, so embedded dashboards can take a long time to load, frustrating end users. If you embed via an iframe, Looker may slow down your pages and even block parts of the UI.
For embedded scenarios, neither Looker nor ThoughtSpot is a great choice. The dashboards will take a long time to load, hindering the user experience. And in the case of ThoughtSpot, it will also rack up your monthly invoice.
This is one of the reasons why we created Embeddable.
Embeddable emphasizes speed. It uses two layers of caching and optimized queries to keep response times under a second. You don’t use iframes at all, so the charts render instantly as part of your page.
Real customer examples boast of lightning-fast dashboards powered by Embeddable. In our tests, Embeddable dashboards render in a few hundred milliseconds, compared to several seconds for Looker or ThoughtSpot embeds. The result: a smooth analytics experience for customers, with no extra coffee breaks needed.
Pricing
Pricing is a major concern for BI tools, internal or embedded, but it plays out differently. For internal reporting, you can somewhat accurately estimate the total cost for running a BI platform, since your user base and requirements are not likely to change much.
In embedded systems, pricing is a much more complex topic. It depends on a variety of factors, from the user base, to the integrations and data sources to the volume of data you need to use.
Both ThoughtSpot and Looker are premium products, but there is a difference in pricing that we need to clarify.
For internal business intelligence
Pricing for Looker is not published publicly and is based on two components: a platform fee (based on edition: Standard, Enterprise, Embed) and per‑user licenses for Viewer, Standard, and Developer roles.
Entry‑level pricing often starts around $35-60k per year, with Viewer access at roughly $30/user/month, Standard users around $60/user/month, and Developer users near $125/user/month.
Mid-sized deployments commonly range from $50-150k annually. Enterprise or embedded setups may exceed $150k and even approach $1 million for large contracts.
On the other hand, here is what the ThoughtSpot website shows as of late July 2025 for internal‐reporting pricing:
- Essentials starts at $25/user/month (billed annually), supporting 5–50 users and up to 25 million rows of data.
- Pro tier, designed for growing teams (25–1,000 users, up to 250 M rows), starts at approximately $50/user/month (billed annually).
- Enterprise pricing is custom quoted, supporting unlimited users and data scale
It’s still not fully transparent, but you can immediately tell that ThoughtSpot is cheaper, and you can get some idea of what the higher plans might run you for your team.
In short, both can become very expensive at scale. For internal reporting, ThoughtSpot’s pricing is more affordable and much more predictable.
For embedded, customer-facing applications
The situation doesn’t get much better with embedded systems, where pricing is crucial. Both tools have very complex pricing structures, and you’ll have to talk to the sales teams to find out how much your monthly invoice is going to be based on your unique requirements.
When it comes to ThoughtSpot Embedded, you can pay per user or usage. In either case, you'll have to talk to sales to find out how much ThoughtSpot will run you. However, the situation is similar in terms of pricing transparency when it comes to most ThoughtSpot competitors.
There are two available plans:
The developer tier is free for up to 10 users and 25 million rows, available for one year of use.
Pro and Enterprise Embedded plans are custom-quoted based on usage, scale, and features.
Looker doesn’t publish prices publicly, but industry sources say they are on a similar order of magnitude: around $60,000 per year for a basic bundle, plus approximately $400 per viewer per year. The cost scales with users, queries, and database usage, making budgeting difficult.
However, both tools have very high costs for embedded analytics, with complex pricing structures.
By contrast, Embeddable uses a flat-fee, usage-based pricing model, with no per-user or per-view fees.
This makes budgeting straightforward. You can freely iterate on dashboards and onboard new customers without worrying about per-seat costs.
Verdict: which is better?
For internal reporting and self-service BI, Looker and ThoughtSpot cater to slightly different audiences. ThoughtSpot tends to be more user-friendly for non-technical teams, offering user-friendly data analytics with good visualizations and affordable pricing, making it a better choice.
The natural-language search lets business users get answers quickly (as long as the data model is ready). Looker, on the other hand, is incredibly powerful in just about every aspect. It offers advanced analytics, extensive drill-downs, and strict governance, but comes at a very steep price and requires analysts who know LookML, their proprietary modeling language.
In other words, ThoughtSpot can be better for smaller teams or those prioritizing ease-of-use, while Looker is aimed at enterprises with complex modeling needs and budgets to match.
A quick comparison of Looker vs. ThoughtSpot
- Visualization options: Looker offers a more extensive selection with better customization, while ThoughtSpot provides a solid but less flexible range.
- Customization: Both have limited customization of their charts, which is not typically a big issue for internal reporting but, making it hard to match brand UI when embedded into another application.
- Integrations & compatibility: Both support major cloud data platforms, with Looker having a slight edge due to native Google Cloud connectivity.
- Performance/loading speeds: ThoughtSpot can be fast but costly per query, while Looker's embedded dashboards can be slow.
- Pricing: Both are premium tools, becoming expensive at scale, especially for embedded use cases, with Looker's pricing being less transparent.
- Embedding methods: Neither is ideal for embedding as they are primarily internal BI tools, leading to issues like clunky UI, slow loading, and limited customization.
If you’re looking for a tool to help you build embedded, customer-facing analytics, both have downsides. ThoughtSpot’s embedded offering is costly and has UX issues; Looker’s is complex and can be slow.
You’ll often end up paying more for seats and queries or wrestling with customization limits. If embedded analytics is a core need, neither ThoughtSpot nor Looker fully solves the problem out of the box.
A better embedded analytics alternative: Embeddable
If your priority is customer-facing analytics, consider a specialized solution. Embeddable, for example, is built from the ground up as a headless embedded analytics toolkit.
Embeddable gives developers full-code control, white-label embedding, and flat-fee pricing. Unlike general BI tools, Embeddable handles the back-end heavy lifting (caching, security, data queries) while giving you 100% control of the front-end. You can import any charting library you like, define your own data semantics, and design dashboards that truly match your visual language and design system.
Importantly, Embeddable’s pricing does not scale with users/viewers/builders – you pay one monthly subscription for unlimited end-users and views.
This eliminates the per-query and per-user fees that make ThoughtSpot and Looker so expensive as usage grows.
For embedded analytics, Embeddable lets you deliver native, blazing-fast dashboards to your customers, without the performance bottlenecks, hidden fees, or branding compromises of the others.
Get started with Embeddable today.
Frequently asked questions
What’s the main difference between Looker and ThoughtSpot for internal BI?
Looker offers more advanced visualizations and customization options, making it a better fit for data teams and analysts who want to build complex dashboards. ThoughtSpot, on the other hand, focuses on ease of use and fast insights, especially for business users with less technical experience.
Can you use Looker or ThoughtSpot for embedded analytics?
Yes, both platforms support embedded analytics, but they aren’t purpose-built for it. ThoughtSpot’s embeds can be buggy and unintuitive. Looker embeds require knowledge of LookML and often load slowly. Both lack the performance, customization, and UX flexibility needed for customer-facing use cases.
Which tool offers better customization for embedded dashboards?
Neither ThoughtSpot nor Looker offers full customization. Both rely on iframe-based embeds with limited styling control. If you need complete branding control and a native look inside your app, Embeddable is a better choice. It lets you build the dashboard directly in your codebase with your preferred charting libraries.
How do ThoughtSpot and Looker compare on pricing?
ThoughtSpot offers published pricing starting at $25/user/month for internal use, but embedded pricing is not transparent and can be expensive. Looker doesn’t publish pricing at all, but industry estimates suggest high costs with per-user and per-query fees. Both tools become costly at scale, especially for embedded scenarios.