Top 11 ThoughtSpot Competitors & Alternatives List
ThoughtSpot is a solid BI tool, but if you're looking for alternatives, we have 11 excellent choices to consider.
Summarize with:
ThoughtSpot is a well-known business intelligence tool, often praised for its search-driven analytics. However, it falls short when it comes to embedded use cases. Its limited visualization options, reliance on iframe-based embedding, steep learning curve, and high costs make it a rapidly-ageing option for teams building customer-facing analytics experiences.
Today, we show you some of the best ThoughtSpot competitors for embedded data analytics and internal reporting and give specific reasons why you should consider them as an alternative.
TL;DR: Best ThoughtSpot alternatives at a glance
Best ThoughtSpot alternatives for customer-facing embedded analytics:
- Embeddable – Best ThoughtSpot alternative for performant, scalable and customisable embedded dashboards and reports, that feel native in your application.
- Luzmo – Best for product teams that need simple embedded, client-facing dashboards fast.
Alternative general-purpose BI tools (with embedding features):
- Sisense
- Basedash
- Domo
- Metabase
- Sigma
- Power BI
- Qlik Sense
- Looker
- AWS QuickSight
- Tableau
Best ThoughtSpot alternatives for customer-facing embedded analytics
Embeddable
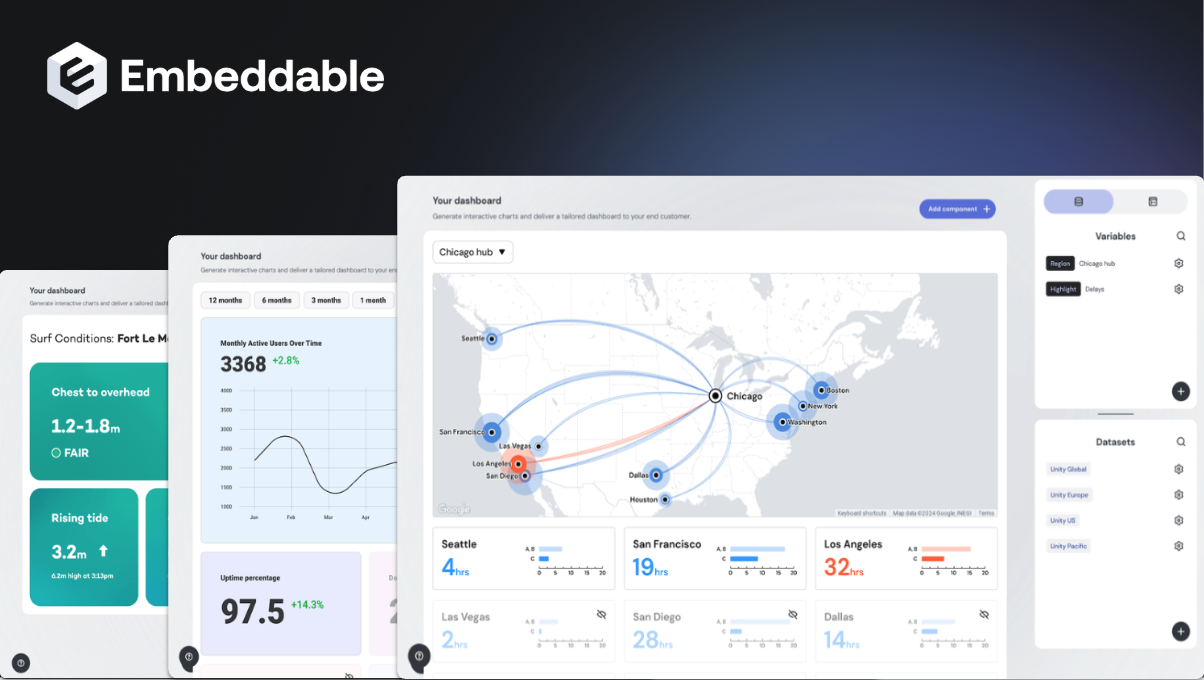
Embeddable is a modern, developer-centric embedded analytics platform. It follows a headless BI architecture, decoupling the data layer from the presentation layer, and giving developers full control over designing custom analytics experiences.
Embeddable allows teams to build highly customized, user-facing dashboards and visuals directly in code, enabling you to import popular open-source charting libraries like Chart.js, Highcharts, Google Charts, and more.
It manages back-end concerns (like caching, security, and database connections) for you, while allowing unlimited front-end customization.
Importantly, Embeddable uses flat-rate pricing (no per-user or per-view fees), so companies can scale usage without unpredictable costs. This is a great benefit for anyone with a growing or fluctuating user base.
How it's better than ThoughtSpot
Embeddable was built from the ground up for embedded analytics, with a modern and powerful architecture designed for task; making it a superior choice for embedded use cases.
It offers code-level customization and control. Developers can modify and extend analytics components in code, enabling truly unique visualizations and interactions that go beyond ThoughtSpot’s more fixed out-of-the-box charts.
Thanks to its built-in semantic layer and headless architecture, Embeddable provides consistent data modeling across the stack and a native look-and-feel when embedded into applications (no iframes), addressing limitations in ThoughtSpot’s embedded analytics options.
Embeddable provides a library of visualizations and lets you import any chart you want from charting libraries, whereas ThoughtSpot’s built-in visualization options are more limited and not extensible. This lets end users analyze data on their terms and get data insights from visualizations that meet their unique needs.
Finally, with its flat-fee pricing model, Embeddable eliminates the usage-based cost surprises that ThoughtSpot customers often face. You pay one predictable rate for unlimited users and dashboards.
In short, for teams that need a highly customizable, developer-friendly analytics solution, Embeddable provides greater flexibility and cost-efficiency than ThoughtSpot. Embeddable is a specialised tool for embedded analytics, not an internal BI reporting tool, so ThoughtSpot is a better choice for your teams’ internal reporting.
Luzmo
Luzmo (formerly Cumul.io) is an embedded analytics platform that delivers customizable dashboards inside SaaS applications. It’s built for product teams that want to deliver customer-facing analytics quickly without building a BI solution from scratch.
Luzmo supports rapid dashboard building and includes embedding features like styling options, API access, and role-based access control.
Luzmo emphasizes user experience, allowing non-technical users to create and manage dashboards while giving developers tools to embed and customize the output. It supports multi-tenant environments and is well-suited for cases where white-labeling and seamless UI integration are critical.
How it's better than ThoughtSpot
Luzmo uses iframe-based embedding, but its focused solely on embedded analytics, which means you'll get less feature bloat and more focus on features for your users.
Luzmo gives teams greater control over user roles and dashboard visibility, making it a stronger fit for multi-tenant or client-facing use cases.
DataBrain
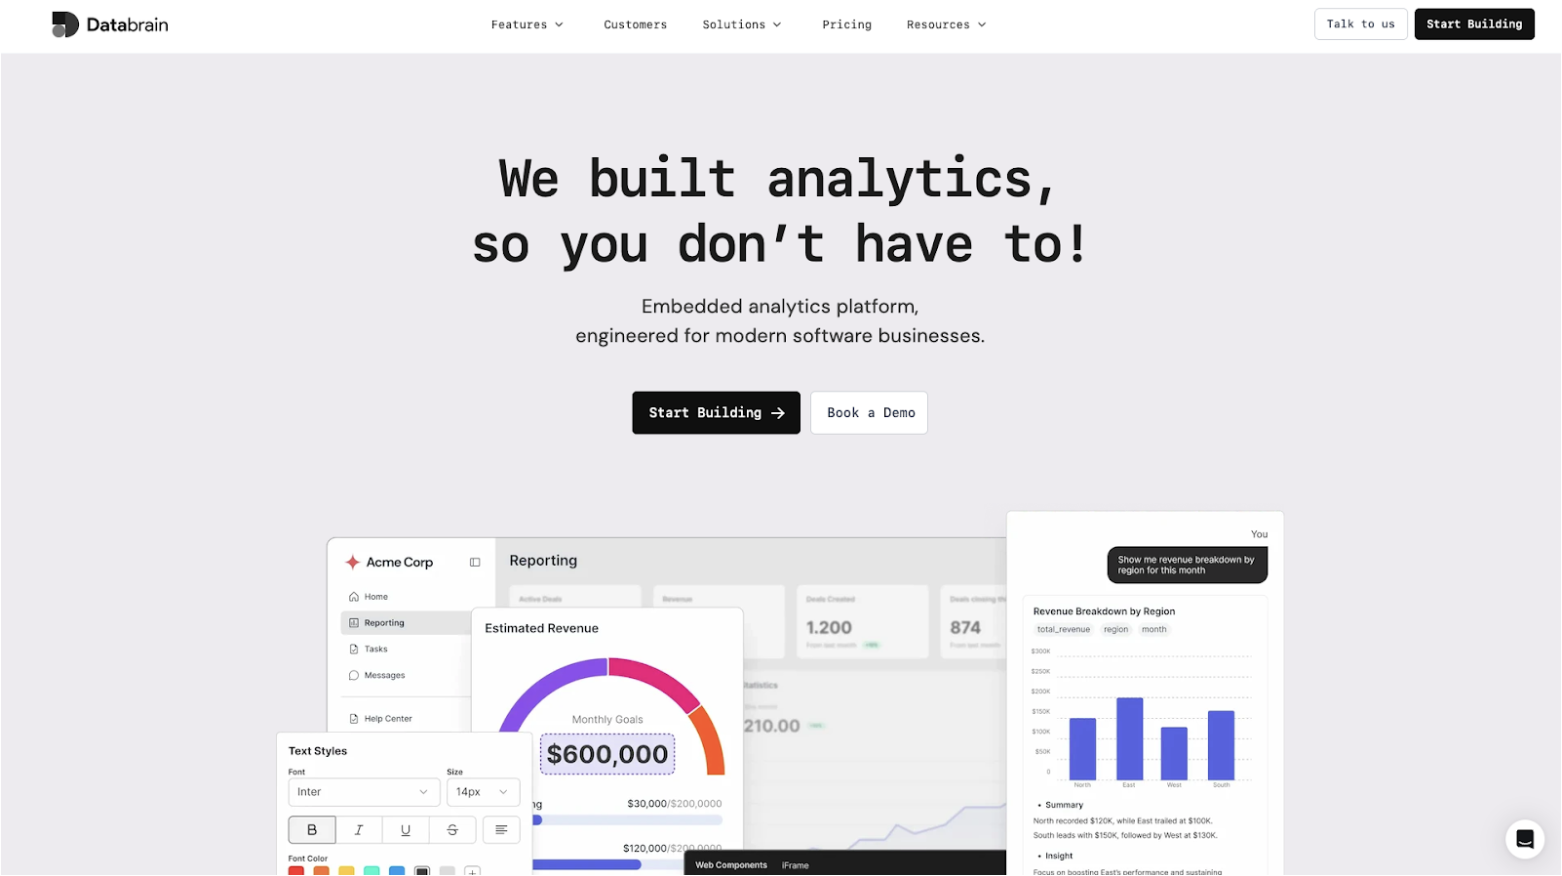
DataBrain is a full-stack embedded analytics platform purpose-built for SaaS companies that need to infuse customer-facing analytics directly into their products. Unlike traditional BI tools like ThoughtSpot that started as internal reporting platforms and added embedding later, DataBrain was engineered from the ground up for seamless product integration.
DataBrain enables developers and product teams to create and embed interactive dashboards and custom reports with a low-to-no-code interface, modern pixel-perfect visualizations, and AI-powered insights. The platform supports self-service analytics where end users can create custom dashboards, apply filters, and query data without SQL knowledge. DataBrain also includes generative AI capabilities that enable end users to chat with their data and receive natural language insights.
DataBrain's key features include: flexible SDKs (React, Vue, Angular) that enable embedding with 2-3 lines of code, white-labeling with custom domains and a menu of UI components, built-in row-level security with automatic multi-tenancy, and real-time data updates without performance degradation.
How DataBrain is better than ThoughtSpot
DataBrain is engineered specifically for customer-facing embedded analytics, while ThoughtSpot was built for internal BI and later adapted for embedding. This leads to very different experiences: DataBrain embeds natively through web components for a more-seamless in-app feel, while ThoughtSpot relies on iframes and fixed Liveboards that always look like ThoughtSpot, even when 'white-labeled'.
DataBrain also offers flat, transparent pricing with unlimited users ($999/month Growth, $1,995/month Pro), making it predictable as you scale. ThoughtSpot’s pricing is opaque and historically included a $25,000/month unlimited-user tier, with costs increasing rapidly as usage grows.
Deployment and usability further widen the gap. DataBrain launches in weeks with minimal setup, and non-technical users can build dashboards with a simple drag-and-drop interface. ThoughtSpot requires heavy data preparation and a steeper learning curve because users must understand query logic and data structures. DataBrain also includes built-in multi-tenancy with automatic RLS and RBAC, while ThoughtSpot lacks strong tenant isolation at scale.
BI tools with embedding features
Sisense
Sisense is a full-stack BI platform that has made a name for itself with strong embedded analytics capabilities. Businesses can infuse analytics into their products or internal portals via extensive APIs and SDKs.
Keep in mind though, that Sisense started out as an internal reporting platform. While it has launched the Sisense Compose SDK, it does not have the full customization capabilities of tools such as Embeddable.
Sisense’s architecture supports combining data from various sources (including big data platforms) and provides a web-based interface for building dashboards.
Key features include in-chip memory processing for speed, an elastic cube for data modeling, and the ability to create custom analytic widgets and even use code (like JavaScript) to extend dashboard functionality.
Sisense enables developers to deeply integrate charts and dashboards into existing applications without disrupting the host application’s look and feel via its new Compose SDK.
It’s often praised for its ability to be white-labeled and for the flexibility to embed analytics anywhere, which is why Sisense is frequently chosen for OEM and embedded use cases.
How it's better than ThoughtSpot
Sisense supports both iframe and JS SDK-based embedding. With the Sisense Compose SDK, you can do some white-labeling and performance optimization.
It supports custom UI theming and embedding via iframes or front-end libraries, allowing the embedded dashboards to blend into the host application more naturally than ThoughtSpot’s embedded Liveboards. Moreover, Sisense lets developers create custom widgets and add-ons to its dashboards.
Sisense also offers a code-first workflow option for data modeling and version control (with Git integration), appealing to engineering teams who want more control over the BI pipeline.
Basedash
Basedash is an AI-native business intelligence platform that lets you use natural language to generate dashboards, reports, and insights in seconds. Unlike traditional BI tools that require SQL knowledge and technical setup, Basedash is built from the ground up with AI capabilities that make data analysis accessible to product managers, analysts, and anyone who needs answers from their data.
The platform's agentic AI writes multiple queries, resolves errors automatically, and evaluates response data to deliver accurate insights. You can connect directly to your database or warehouse, or use Basedash Warehouse to sync 600+ data sources without querying production. The AI understands your schema, KPIs, and internal terminology, so you don't need to know exact table or column names to get the data you need.
How it's better than ThoughtSpot
Basedash's AI-native architecture fundamentally changes how teams interact with data compared to ThoughtSpot's search-driven approach. While ThoughtSpot requires users to learn query syntax and understand data structures, Basedash's agentic AI handles the complexity. It writes queries, catches errors, self-corrects, and delivers accurate results without any SQL knowledge required. The AI even understands your custom KPIs and internal jargon, adapting to how your team actually talks about data.
For teams without existing data infrastructure, Basedash Warehouse provides a complete solution that ThoughtSpot doesn't offer. You can connect 600+ data sources, and Basedash automatically sets up a warehouse for you, built on ClickHouse with no vendor lock-in. This eliminates the need to query production databases and handles complex queries without affecting user experience.
The platform also excels in performance and user experience. Basedash delivers a multiplayer SQL editor with auto-formatting, variables, and version history for technical users, while non-technical teammates can explore data with spreadsheet-like familiarity. This dual approach serves entire teams better than ThoughtSpot's one-size-fits-all interface.
Domo
Domo is a cloud-based BI platform that delivers an end-to-end solution, from data integration to analytics. It comes with an extensive set of built-in data connectors to bring in data from dozens of sources, and it emphasizes real-time data visualization and easy sharing of insights.
Domo’s platform allows users to create interactive dashboards and reports and supports collaboration features such as commenting and annotation directly within the dashboards. Like Sisense and ThoughtSpot, it’s primarily an internal reporting tool, so expect the embedding process to be more complex.
One notable aspect of Domo is its mobile-first approach – the platform is very mobile-friendly, enabling executives and teams to monitor KPIs on the go. Domo can embed dashboards in other tools and offers a relatively user-friendly drag-and-drop interface for building visuals, targeting users across the spectrum of technical skills.
How it's better than ThoughtSpot
Domo’s all-in-one, user-friendly experience can be a significant advantage over ThoughtSpot for many organizations. First, Domo makes it straightforward to connect and unify data from multiple sources into a single view; it has native connectors and a built-in ETL system, whereas ThoughtSpot typically relies on an existing data warehouse and external data prep processes.
This means Domo can handle more of the heavy lifting if you don’t have a robust data pipeline in place.
Second, Domo’s focus on real-time dashboards and ease of use for non-technical users (with its drag-and-drop card builder and app-like interface) means business users can get value quickly, in contrast to ThoughtSpot which, while easy to query, may require more initial setup to define the schema for search.
Additionally, Domo includes built-in collaboration and social features – users can chat, tag each other, and share insights within the platform.
This is good for teams that want to discuss data findings in context, a capability that ThoughtSpot doesn’t directly provide within its interface. Domo’s packaging with standard and enterprise editions offers some structure, but pricing can still vary significantly depending on scale and contract terms.
Metabase
Metabase is a popular open-source BI tool tailored for teams that want quick access to insights without a steep learning curve. It’s especially valued in startups and mid-sized companies due to its clean interface, SQL and no-code query support, and ease of deployment.
Users can quickly connect Metabase to a range of data sources, from Postgres and MySQL to big data engines like Druid and Redshift. Dashboards can be created with minimal setup, making it ideal for companies that want to get up and running quickly with internal analytics.
Metabase also offers embedding options, making it possible to deliver analytics to customers within apps or portals. While customization is more limited than headless BI tools, Metabase provides developers with API access and dashboard embedding tools that suit many SaaS platforms.
How it's better than ThoughtSpot
Metabase offers a much gentler learning curve than ThoughtSpot, especially for teams with limited technical resources. Its open-source nature means companies can host it on their own infrastructure without licensing costs.
Metabase supports embedded dashboards with basic theming and user-level permissions but it lacks full UI programmability for deeply branded embedded experiences.
Additionally, its support for both SQL-based and visual querying makes it flexible for analysts and non-technical users alike. While ThoughtSpot emphasizes search-driven analytics, Metabase is better for organizations that want a more traditional dashboarding experience with simpler deployment and broader hosting options.
Metabase can be self-hosted for free but we covered Metabase pricing in detail on our blog too. You may also be interested in a comparison between Metabase and Tableau, as well as Metabase and Power BI.
Sigma
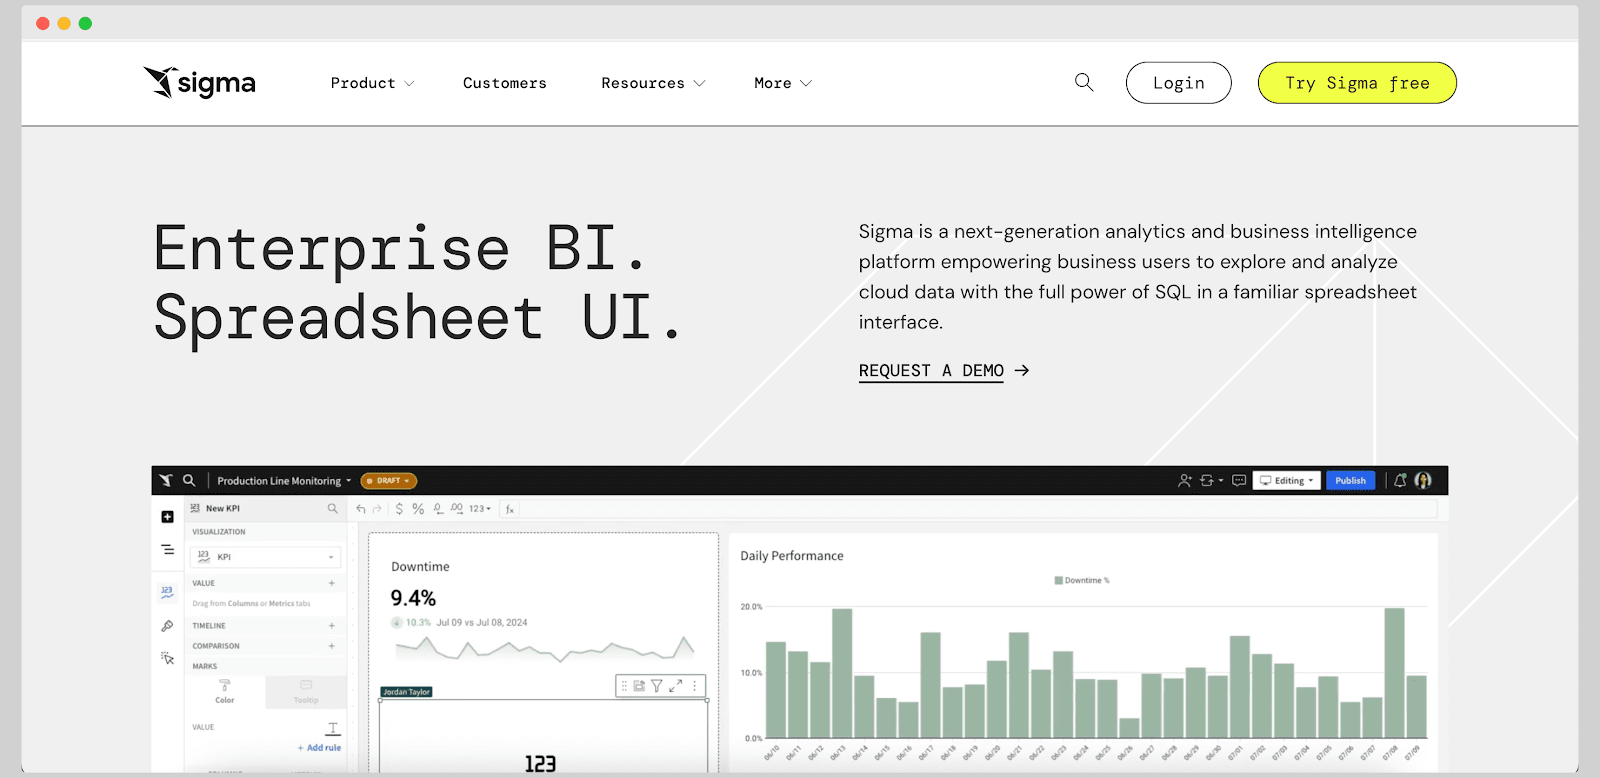
Sigma is a cloud-native BI platform that brings the power of spreadsheets to big data. It’s designed for business users who are comfortable working in spreadsheet-like interfaces but need the scalability and security of a modern cloud data stack.
Sigma connects directly to cloud data warehouses like Snowflake and BigQuery, allowing live querying without data extraction.
One of Sigma’s standout features is its real-time, collaborative environment that enables multiple users to work on data simultaneously. It also includes embedded analytics functionality, allowing organizations to share insights beyond their internal teams.
Sigma’s spreadsheet metaphor lowers the barrier to entry for data exploration, while its governed access ensures IT teams can maintain control over metrics and access.
How it's better than ThoughtSpot
Sigma’s spreadsheet-first approach makes it a better fit for teams who are already working with Excel or Google Sheets but want to graduate to scalable analytics.
Unlike ThoughtSpot, which requires a shift in mental models toward search-driven queries, Sigma offers a familiar environment with stronger collaborative features. It’s also more conducive to building embedded analytics into client-facing products, giving developers greater flexibility in interface control.
It’s worth noting that Sigma provides flexible embedding for many SaaS use cases but lacks the full UI programmability of headless embedded tools.
Power BI
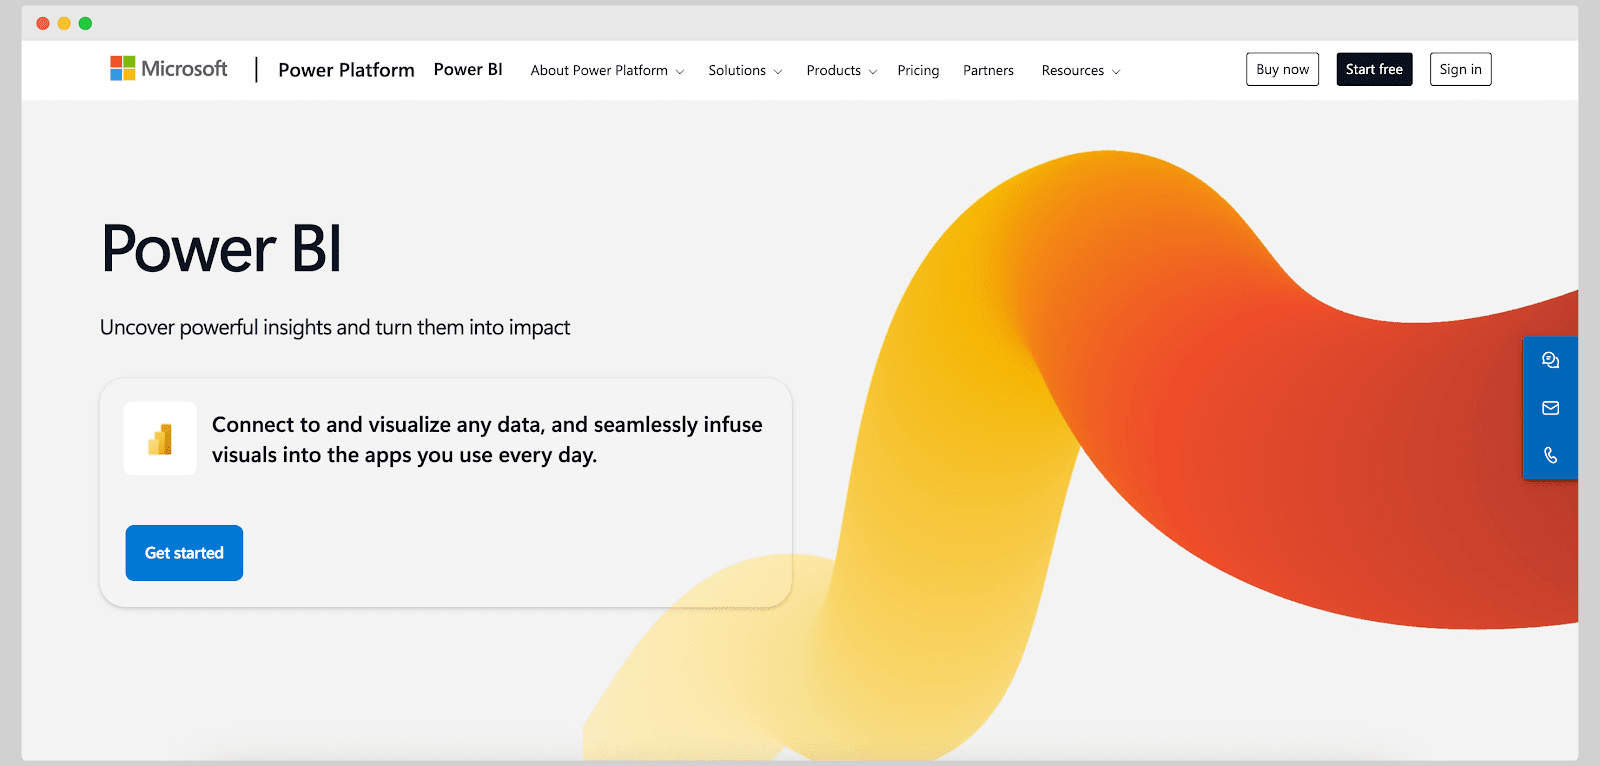
Microsoft Power BI is a business intelligence platform known for its rich visualization capabilities and integration within the Microsoft ecosystem. It lets users connect to numerous data sources and create interactive dashboards via an intuitive drag-and-drop interface.
Power BI is available as a cloud service and a desktop application, and it ties into tools like Excel, Azure, and Microsoft Teams, which is ideal for organizations already using Microsoft products.
There is also a large community and a wealth of learning resources, which makes adoption easier. Power BI’s pricing is relatively accessible, with a free tier and low-cost per-user plans.
How it's better than ThoughtSpot
For companies in the Microsoft ecosystem or those seeking a more budget-friendly BI solution, Power BI has clear advantages over ThoughtSpot.
First, Power BI offers affordability and flexible licensing, including free and low-cost Pro versions, whereas ThoughtSpot is a premium product with a higher cost.
Second, Power BI’s tight integration with Microsoft Office tools means users can more easily embed analytics into their existing workflows. In contrast, ThoughtSpot is a standalone platform that doesn’t blend as naturally into common office productivity suites.
Finally, Power BI’s robust traditional dashboarding and reporting capabilities give organizations more flexibility in presenting data, which can be an advantage over ThoughtSpot’s relatively narrow focus on search-driven analytics.
When it comes to Power BI and embedding, we covered that in a different article.
Qlik Sense
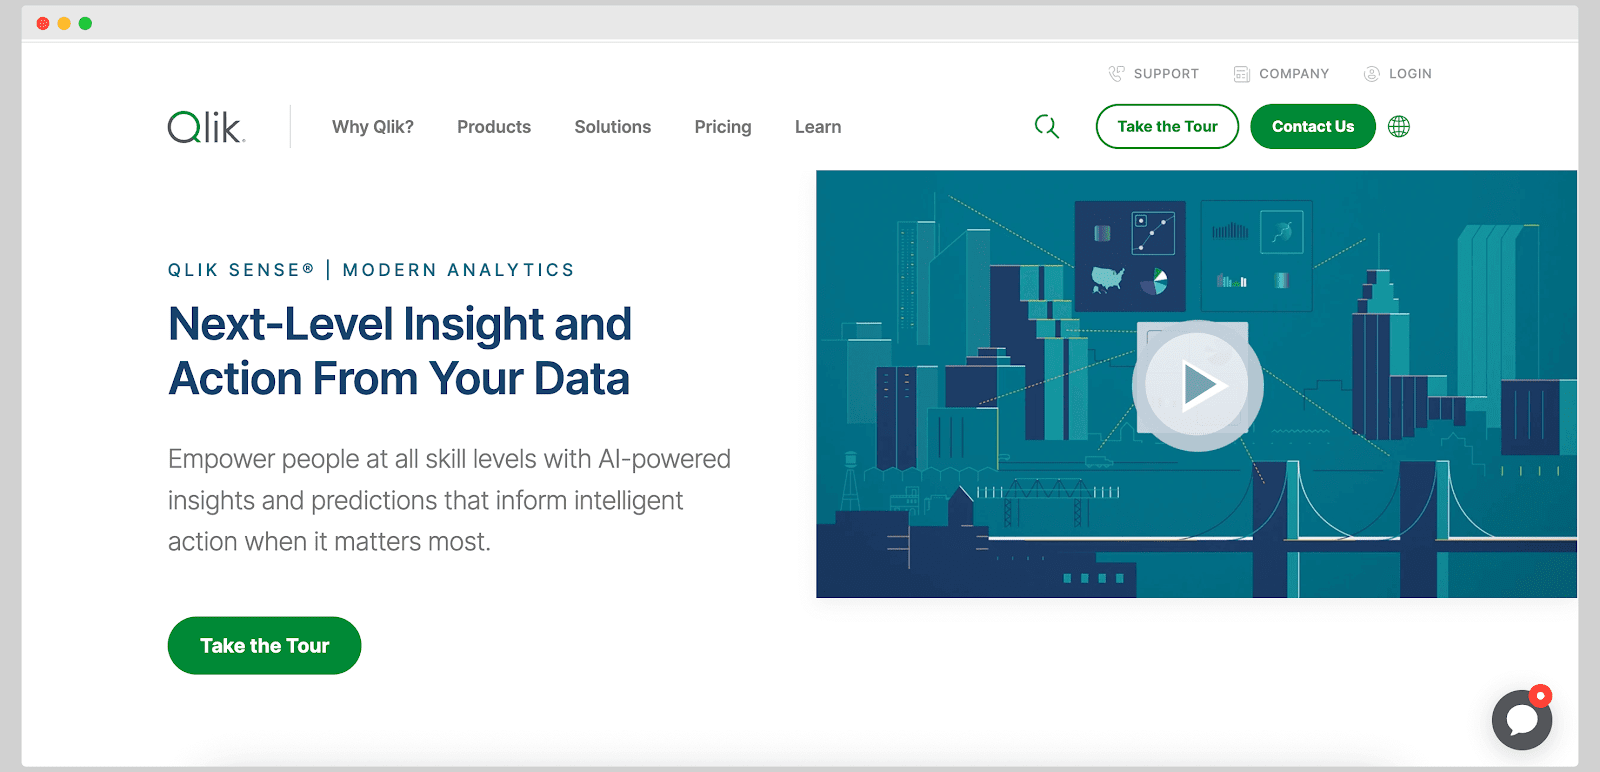
Qlik Sense is a BI platform from Qlik, a veteran in the analytics space. Qlik Sense is best known for its associative data engine, which allows users to explore data in a flexible, non-linear way.
Unlike traditional query-based BI tools, Qlik’s associative model lets you select any field and see how it relates to all others, uncovering hidden relationships and insights without pre-defined drill paths
Qlik Sense supports interactive dashboards, custom analytics apps, and even embedded analytics, and it can be deployed on-premises or in the cloud, offering flexibility for different IT environments.
It also includes augmented analytics features (like AI suggestions and natural language querying) to assist users in data exploration.
How it's better than ThoughtSpot
Qlik Sense’s associative exploration capability gives it an edge over ThoughtSpot’s search-based approach. With Qlik, users can freely navigate data by making selections and filters in any order, which often reveals correlations and trends that might be missed in ThoughtSpot unless specifically queried.
This makes Qlik Sense exceptionally good for data discovery and ad-hoc exploration, empowering users to answer questions they didn’t even know to ask.
Qlik’s long history in BI means it also has a rich set of features for developers (APIs, extension plugins) to create custom chart types or embed Qlik analytics into other applications. For intuitive, exploratory analysis and flexibility in deployment, Qlik Sense can be better suited than ThoughtSpot, especially in scenarios where the data relationships are complex and not predetermined.
Qlik has expanded its developer options with Nebula.js and Capability APIs, which allow more control compared to pure iframe embedding. Not full code-first headless, but more than a basic iframe.
Looker
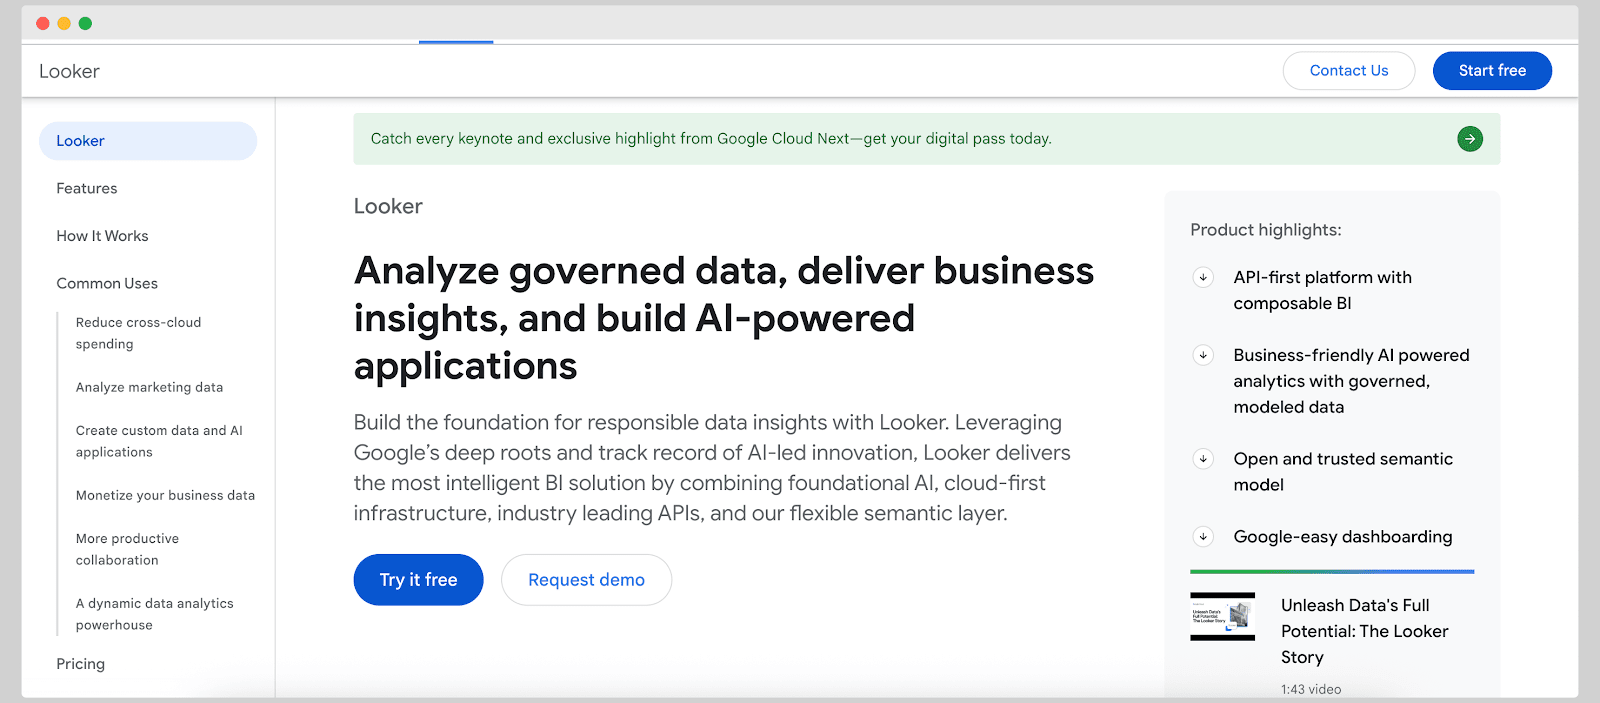
Looker is a BI platform that originated with Looker (acquired by Google) and has since been integrated with Google’s cloud offerings. It is built around a powerful semantic modeling layer (LookML), which allows data teams to define business metrics and data relationships in a centralized way.
It is not to be confused with Looker Studio, previously known as Google Data Studio, which is a marketing reporting platform.
Looker excels at creating a single source of truth for data definitions and offers comprehensive reporting and dashboard capabilities.
It connects natively to a wide range of databases and cloud data warehouses (BigQuery, Snowflake, Redshift, etc.) and can leverage Google’s infrastructure for scalability.
Looker also supports embedding analytics into other applications and has APIs for customization, making it suitable for embedded use cases. Its integration with Google Workspace tools (like Google Sheets and Slides) facilitates easy sharing and collaboration on insights.
How it's better than ThoughtSpot
Looker’s key advantage over ThoughtSpot is its model-driven approach to analytics and its integration capabilities. With Looker, organizations can define complex business logic in LookML, ensuring consistent metrics across all reports, which is something that ThoughtSpot’s ad-hoc search approach doesn’t inherently provide.
This makes Looker superior for enterprise-wide reporting and governance of metrics.
Looker also integrates with Google’s cloud ecosystem and productivity tools, which can streamline workflows for companies already using Google Cloud or Workspace.
In short, if you need a BI tool that offers robust data modeling, custom embedded analytics, and deep integration with cloud data sources, Looker provides advantages in those areas over ThoughtSpot.
AWS Quicksight
Amazon QuickSight is AWS’s business intelligence service, aimed at organizations already operating within the AWS ecosystem. It’s designed for scalability and offers serverless deployment, automatic scaling, and a pricing model based on usage. QuickSight integrates natively with AWS data sources like S3, Athena, Redshift, and RDS, making it particularly attractive for companies with cloud-native infrastructure.
QuickSight provides interactive dashboards, ML-powered insights, and natural language querying. It also supports embedding, making integrating dashboards into internal and external applications possible. While it may lack some of the more advanced customization of developer-first tools, it compensates with scalability and deep integration with AWS services.
Some customization is possible (theming, interactions) but not to the full code-first extent of headless platforms.
How it's better than ThoughtSpot
QuickSight is more tightly integrated with AWS than ThoughtSpot, making it the go-to option for teams working heavily within Amazon’s cloud. Its pay-per-session pricing can also be more cost-effective for organizations with variable usage patterns.
Additionally, QuickSight’s use of ML insights and native embedding capabilities provide a more scalable and flexible analytics experience for AWS-centric environments.
Tableau
Tableau, now part of Salesforce, is one of the most established BI and data visualization platforms. It’s renowned for its ability to turn complex data into interactive, beautiful visualizations and dashboards. Tableau comes with a large library of chart types and advanced visualization options, empowering users to drill deep into data and uncover insights.
It also offers features for data preparation and supports connecting to a wide variety of databases and cloud data warehouses. Tableau has a strong user community and many years of refinement in its UI, making it a go-to tool for analysts who need powerful visual analytics.
One caveat: Tableau was originally built as a desktop BI tool, so while it offers web embedding capabilities, it primarily uses iframes, and its embedded dashboards carry Tableau branding by default. This means it’s not optimized for deeply white-labeled embedded use, as customization of the embedded UI is limited.
Tableau’s Embedded Analytics SDK allows some branding control, but full UI white-labeling is still limited compared to developer-first tools.
How it's better than ThoughtSpot
Tableau’s strength lies in data visualization and analytic depth, where it often outshines ThoughtSpot. It provides a wider array of visualization types and more advanced formatting and customization of dashboards than ThoughtSpot offers.
This means data teams can craft highly tailored visual stories and complex interactive dashboards in Tableau, which might be challenging in ThoughtSpot’s more streamlined interface. Additionally, Tableau is a more mature and time-tested platform – it has been in the BI market for much longer than ThoughtSpot. It has an established track record in various industries.
This maturity translates to a rich feature set (including extensive geo-analytics, sophisticated calculations, and a robust ETL add-on in Tableau Prep) that can provide more analytical firepower in experienced hands. In summary, for use cases that demand top-tier data visualization, fine-grained control over dashboard design, and an entrenched community of practice, Tableau offers clear advantages over ThoughtSpot.
Just remember that if your goal is deeply embedded analytics with full white-labeling, neither ThoughtSpot nor Tableau excels, as both have some limitations on that front.
Conclusion
For teams building customer-facing analytics experiences, the choice is clear. Traditional BI tools like ThoughtSpot, Tableau, and Power BI were not built for embedding. If performance, branding, and control matter, you'll need something built for the job.
That’s where Embeddable shines. It's the only tool on this list designed from the ground up for embedded analytics.
Frequently asked questions
1. What makes Embeddable better than ThoughtSpot for embedding?
Embeddable integrates analytics directly into your app’s DOM via native SDKs or web components, offering deeper UI control, faster rendering, and seamless white-labeling without relying on iframes. ThoughtSpot’s Visual Embed SDK still requires embedding within an iframe boundary, which limits performance, seamless styling, and interaction fluidity.
2. Can I use Tableau or Power BI for embedded analytics?
Yes, but both rely on iframe rendering for core delivery. Power BI Embedded offers APIs that allow some degree of UI integration, but full white-label control is limited.
3. Is ThoughtSpot good for internal analytics?
Yes, ThoughtSpot’s search-driven analytics are useful for internal use, but it lacks flexibility in visualization and embedding.
4. Are there free or open-source ThoughtSpot alternatives?
Metabase is a great open-source option for internal use. It supports SQL and no-code dashboards with basic embedding.
5. What’s the most customizable embedded analytics tool on this list?
Embeddable provides the most flexibility, offering code-first UI control and native SDK-based embedding.