2026 Embedded Analytics Solution of the Year (Data Breakthrough Awards) & G2 High Performer

Embed charts

A better way to embed charts in your product

A chart library only draws the chart. Embeddable also does the parts you'd otherwise build yourself: keeping each customer's data separate, staying fast as you grow, a theme for every customer, and exports.

  • <em-beddable>Charts in your product with one tag, no iframe
  • Each customer sees only its own rows, scoped by a server-side token
  • Keep your chart library, or use ours: open source, built on Chart.js

SOC 2 Type II & GDPR-compliant · EU or US hosting · In production at companies from 4 to 40,000 employees

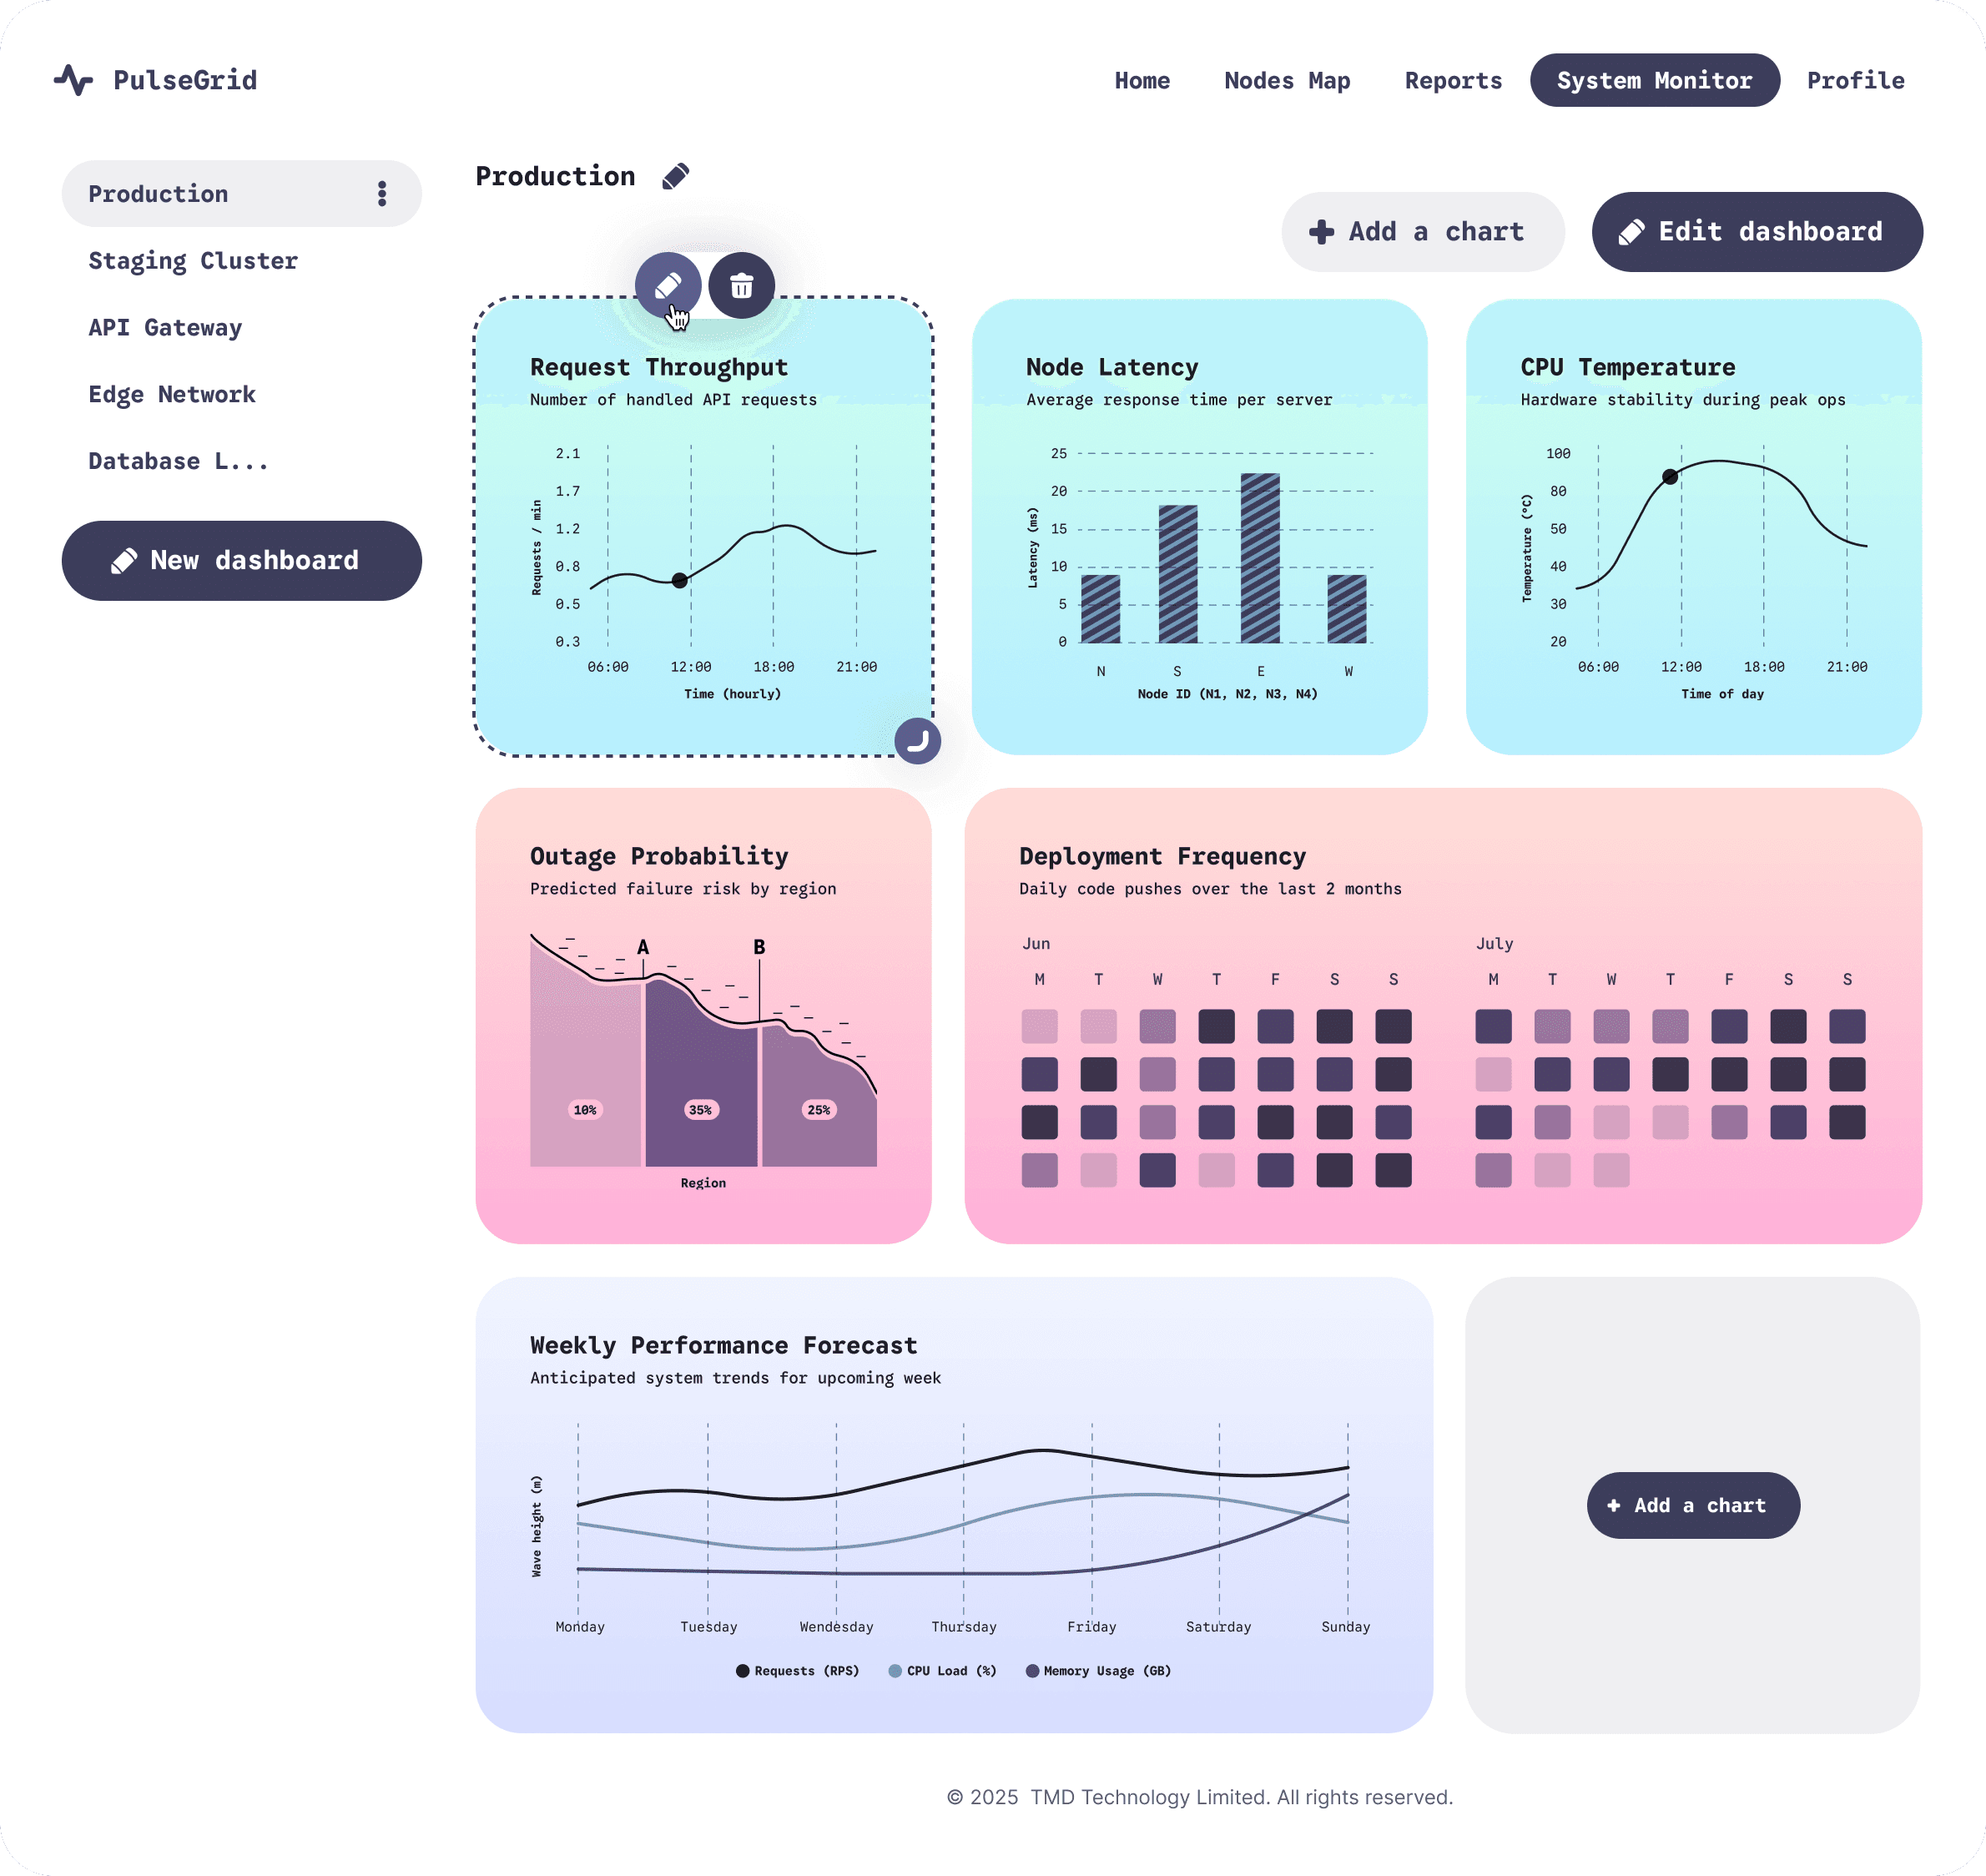
Charts inside a customer's own app, in its colours, with Add a chart and Edit dashboard
Beyond the chart

What a chart library leaves to your team

A chart library draws a chart from the data you give it. The rest is up to you: keeping each customer's data separate, keeping charts fast as you add customers, and giving each customer their own look. You can skip it in week one. You can't skip it once real customers arrive.

Security

Each customer sees only its own data

With a chart library alone, your team builds

Customer A must never see customer B's rows: not in a chart, not in a filter dropdown, not in a cached result. That means row-level security, scoped tokens and a permissions model you re-verify on every change.

With Embeddable

  • Your server fetches a short-lived token from the Tokens API for each user session, so your API key never reaches the browser.
  • Security filters in the token are enforced on every query, and if one can't be applied the query fails instead of returning another customer's rows. A shared database or one per customer both work.
  • Embeddable connects through a read-only account and runs live queries; it does not store a copy of your database. SOC 2 Type II, with EU or US hosting.
Scale

The data API, caching and performance at volume

With a chart library alone, your team builds

A chart library renders the data you hand it, so every chart needs an endpoint behind it. Then hundreds of tenants refreshing at 9am means caching, pre-aggregation and connection pooling, against production databases you must not slow down.

With Embeddable

  • Charts ask for the dimensions and measures they need, and Embeddable builds each query from your data models, then serves the result from your database or its cache.
  • An in-memory cache is on by default and helps protect your database from load. Pre-aggregations, refreshed for each security context, answer busy dashboards without scanning raw data.
  • Unlimited usage on a flat subscription, so more customers viewing charts does not grow the bill.
Per customer

A theme, exports and self-serve views for each customer

With a chart library alone, your team builds

Customer A wants different columns, customer B different metrics, customer C a chart hidden. Add their branding, exports, saved views and defaults, and a chart quietly becomes a configuration system you own forever.

With Embeddable

  • One theme file in your repo sets colours, fonts and corner radius, and you can keep a theme per customer. No Embeddable branding.
  • Each chart menu offers CSV, XLSX and PNG downloads.
  • With Custom Canvas you choose the datasets and charts on offer, and customers build and save their own dashboards, still filtered to their own data.
Your chart library

Keep your chart library

Embeddable's charts are open source and built on Chart.js, and you are not limited to them: import any React charting library, or build your own components.

  • Wrap the chart you already use

    A custom component is standard React, built with any JS library you like (Chart.js, Recharts, ECharts, D3), with an Embeddable configuration file beside it.

  • It gets the same data layer

    It loads its data through loadData, from your database or the cache, with the same token and row-level security as every other chart.

  • Or start from ours

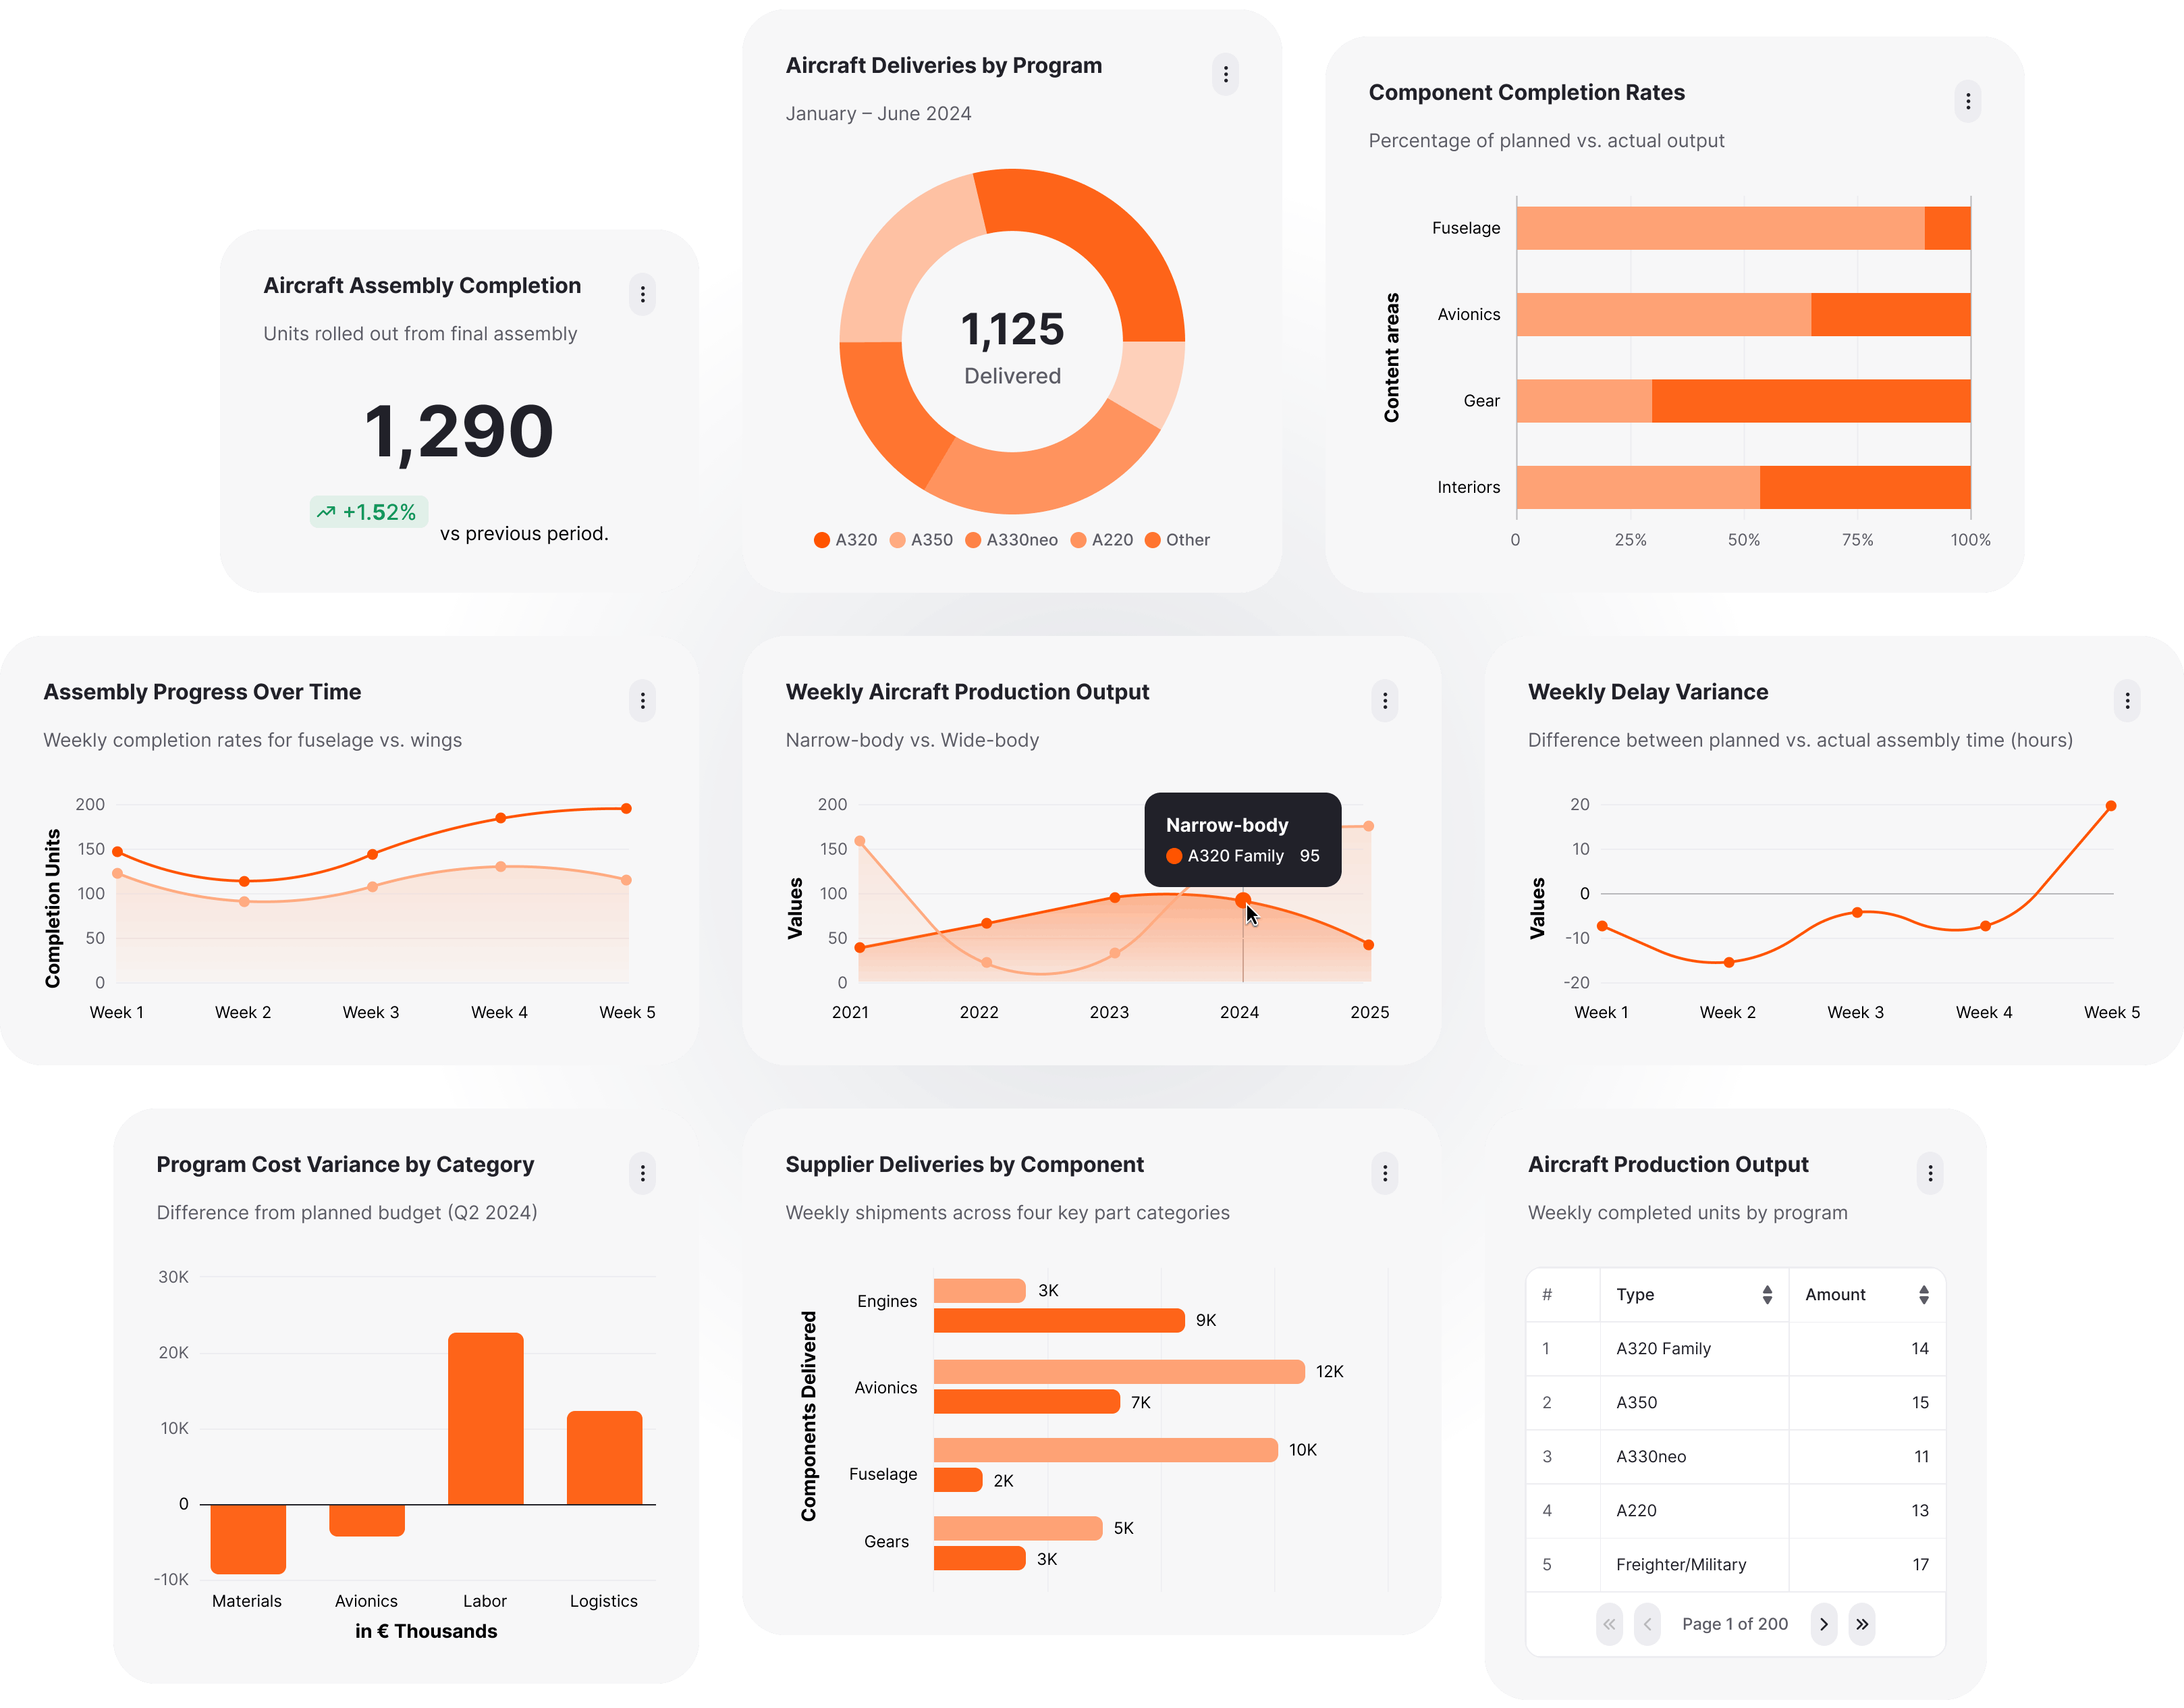
    Remarkable Pro's bar, line and donut charts, KPI tiles, tables and heatmaps are ready-made, and you can override any chart's Chart.js options in your theme. New components can be written by hand or by prompting an AI agent.

OrdersChart.emb.ts

import { defineComponent } from '@embeddable.com/react';
import { loadData } from '@embeddable.com/core';
import Component from './index'; // your chart, your library

export default defineComponent(Component, meta, {
  props: (inputs) => ({
    ...inputs,
    results: loadData({
      from: inputs.ds,
      select: [inputs.myDimension, inputs.myMeasures],
    }),
  }),
});

Used by top companies

Built for developers, loved by product and data teams. In production at companies from 4 to 40,000 employees.

Steer
Noq
Monta

"We have been able to dramatically improve our dashboard product offering in our web applications."

Brian Rountree, VP of Engineering
Resident Advisor
MPathic
Playtomic

"It helped us change internal ownership, dramatically reducing time to market and opening up new possibilities"

Marco Rossi, Director of Data
GetEnter
FSG
Fashion Cloud

"Our platform's 'Insights' feature is a USP that has left customers incredibly pleased and impressed."

Niklas Reher, Sr. Business Analyst
Pay.com
Fanatics

"It's a missing part of the ecosystem"

Steve Morin, Director of Engineering, Asana
End to end

How it works

Embed native charts in your product, without iframes, with each customer's data scoped on every query.

  1. your-repo/
    • components
      • datatable.tsx
      • kpichart.tsx
      • linechart.tsx
    • data-models
      • accounts.yml
      • usage.yml
      • transactions.yml
    • dashboards
      • executive-overview.yml
      • sales-performance.yml
      • usage-analytics.yml

    A code-first foundation

    Data models and components live in your own repo - version-controlled, reviewed, and pushed to Embeddable via the SDK.

  2. your-repo/
    • components
      • datatable.tsx
      • kpichart.tsx
      • linechart.tsx
    • data-models
      • accounts.yml
      • usage.yml
      • transactions.yml
    • dashboards
      • executive-overview.yml
      • sales-performance.yml
      • usage-analytics.yml

    A world-class component library

    Open source and fully extensible. Use ours, customize, or write your own - by hand or with an agent.

    Preview of an Embeddable chart component
    + 30 more · all open source, all in your repo
  3. your-repo/
    • components
      • datatable.tsx
      • kpichart.tsx
      • linechart.tsx
    • data-models
      • accounts.yml
      • usage.yml
      • transactions.yml
    • dashboards
      • executive-overview.yml
      • sales-performance.yml
      • usage-analytics.yml

    A governed semantic layer

    Cube-based data models govern access and define each metric once - so every dashboard and chat answer agrees.

    accounts.yml
    cubes:
      - name: accounts
        measures:
          - name: revenue
            type: sum
        dimensions:
          - name: tier
            type: string
    8 dashboards
    AI chat
    RLS
  4. your-repo/
    • components
      • datatable.tsx
      • kpichart.tsx
      • linechart.tsx
    • data-models
      • accounts.yml
      • usage.yml
      • transactions.yml
    • dashboards
      • executive-overview.yml
      • sales-performance.yml
      • usage-analytics.yml

    Trusted, scalable data experiences

    Models and components combine into the experiences your users see - dashboards and AI chat built from the same governed foundation.

  5. your-repo/
    • components
      • datatable.tsx
      • kpichart.tsx
      • linechart.tsx
    • data-models
      • accounts.yml
      • usage.yml
      • transactions.yml
    • dashboards
      • executive-overview.yml
      • sales-performance.yml
      • usage-analytics.yml

    Self-serve dashboards

    Native, interactive dashboards - drilldown, filters, and self-serve included - built in code, our no-code builder, or via an agent.

    executive-overview.yml
    name: Executive overview
    models: [accounts, transactions]
    components:
      - kpichart:
          value: accounts.revenue
      - linechart:
          data: transactions
  6. Why did revenue dip in March?

    Two enterprise renewals slipped to April. Usage held steady, so April recovers the gap.

    accounts.ymlRLS enforced

    AI chat, grounded in your data

    Users ask in plain language and get answers as text or live charts, without leaving your product. Grounded in your semantic layer, respecting row-level security. Bring your own LLM.

  7. your-app.html
    <em-beddable token="49fe..."/>

    Native embedding in one tag

    One web component drops into any app - React, Vue, plain HTML. Native, not an iframe. Server-side tokens scope every view to the signed-in user.

  8. Multi-tenant secure
    Row-level security
    Fast at scale
    Multi-tier caching
    Fully audited
    Every query logged
    Controlled self-serve
    Within your guardrails
    Versioned & reviewed
    Everything in git
    SOC 2 Type II
    Enterprise-grade

    Production-ready from day one

    Multi- and single-tenant secure, fully audited, SOC 2 Type II. We handle the hard infrastructure so you can focus on the experience.

    That's why we're trusted in production by companies from 4 to 40,000 employees.

Loved by developers

What customers say

Brian Rountree
VP Engineering, Monta
"We have been able to dramatically improve our dashboard product offering in our web applications and now have a solid foundation to iterate"
Read case study
Ritchie Cargill
Tech Lead, Resident Advisor
"Using Embeddable is making it easier & faster to build dashboards for our customers - making changes in a no-code builder without engineering input"
Read case study
Brian Williams
CTO, mpathic AI
"Embeddable has provided us with the flexibility and speed to enhance our analytics without significant development overhead"
Read case study
Pricing

Unlimited usage for a fixed price

A flat monthly subscription with unlimited usage, every feature, and complete price-predictability.

  • Predictable monthly costs - without surprises
  • No usage-based pricing - scale freely
  • Startup / Early stage

    Embed your first dashboard in production in days, not quarters

  • Scale-up / Mid-market

    Expand across teams and products with more structure and control.

  • Enterprise

    Advanced deployments with security, scale, and customization.

FAQs

A better way to embed charts in your product

A developer toolkit to ship native embedded charts, with per-customer security, caching and theming built in

Ask us