11 Embedded Analytics Use Cases and Examples to Learn From
Embedded analytics use cases that show how real companies make use of embedded analytics and what kind of pain points it solves for their end-users.
Summarize with:
Embedding dashboards and other data insights into SaaS applications is a tried and tested way of adding value to end users and helping products to grow. It can be difficult to start considering an embedded analytics platform if you don't know the benefits it brings for your product, customers, and overall business. But, when you are choosing a stack, start with our top embedded analytics tools guide.
Whether you're a developer, product manager, CTO or just curious, we're here to show you some great examples of embedded analytics. We'll show you how an embedded analytics solution can help your business and how you can get started.
What is embedded analytics and how does it work?
Embedded analytics is the practice of embedding data analytics into a product or a website, so that your end-users or customers can access data insights. Unlike traditional business intelligence tools, embedded analytics platforms allow users to access data insights directly in an app, without logging into a third-party platform.
Embedded analytics tools use APIs, integrations, and data connectors to pull data from your app (or data warehouses, data centers, data lakes, and similar). The end user can then create data visualizations, perform ad-hoc data analysis, or engage in predictive analytics, etc.
A common example is Shopify, the popular e-commerce platform. All Shopify users get access to a dashboard that shows sales trends, customer behavior, top products, and real-time traffic data right inside your store interface. That’s embedded analytics: analytics built into the product itself, not a separate system.
Equipped with this information, Shopify users can devote themselves to data driven decision making, improve their business processes, and increase customer satisfaction, all the while growing their revenue.
The benefits of using an embedded analytics solution
Turning data into actionable insights sounds like a decent pro for embedded analytics. However, setting up embedded dashboards can take thousands of dollars and months of work if you opt to build it in-house with your own developers. Here are some real benefits of using embedded analytics tools.
- An improved user experience: your customers don't have to use a separate analytics tool to access their data. For example, if you have a customer relationship management tool, they can access and analyze data right in the app, just a few clicks away.
- Competitive advantage: there's a strong chance that the leaders in your industry already use embedded analytics software. With embedded dashboards, you have a powerful advantage over the competition. Also, many customers now expect self service analytics right out of the box.
- New revenue streams: many businesses charge extra for their customers to be able to use embedded analytics in their apps. You can create new pricing plans or charge for data driven insights as an add-on.
- Lower engineering burden: your dev team should spend time working on your core product, not figuring out how embedded analytics work. Purchasing an off-the-shelf embedded analytics platform saves time and money.
- Higher user engagement: as users get access to real time insights through interactive visualizations, your app becomes stickier and provides them a reason to return.
- Increased product adoption and lower churn: data driven decision making shows customers a higher immediate ROI from your product, making it less likely that they switch to a competitor.
- Supports secure data access: thanks to row-based access control, you can determine who can access sensitive data and set different access levels for different user groups.
The best embedded analytics examples and use cases for businesses in 2025
You can use embedded analytics in almost any app or platform to gain actionable insights for your team or end-users. But it can be pretty difficult to get inspired if you don't have a starting point. Here are some embedded analytics use cases you can learn from.
1 AnyCreek
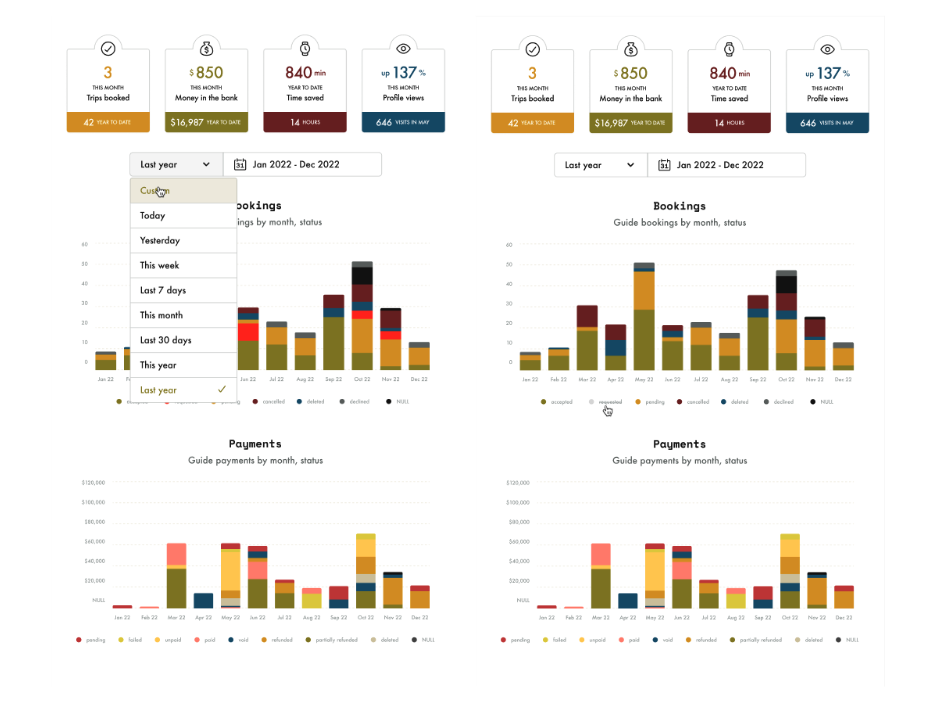
AnyCreek is an online marketplace for outdoor guided experiences, helping professional guides manage their business. It streamlines back-office tasks so guides can focus on leading trips and adventures. With a reputation among top guides, AnyCreek connects adventure providers with customers, handling bookings, payments, and admin work in one platform.
Use case
AnyCreek’s team noticed growing demand from guides for better insight into their earnings and bookings on the platform. They wanted to provide every guide with an in-app dashboard showing metrics like revenue and number of bookings, all in real time.
"We are able to meet the requirements from customer feedback and ultimately we expect that implementing analytics with Embeddable will drive growth + engagement."
Initially, they manually pulled data for larger clients or relied on basic internal tools, but this wasn’t scalable or user-friendly. The goal was to embed a polished analytics dashboard directly into AnyCreek’s web app, matching the look and feel of the platform.
AnyCreek looked at various solutions that could integrate with their React/Next.js stack and Postgres database, ultimately finding that Embeddable’s toolkit fit their needs for quick development and a seamless UI.
The outcome
By using Embeddable for their dashboards, AnyCreek was able to deliver this analytics feature fast without diverting heavy engineering resources. The company remained lean – their developers quickly dropped in rich charts and graphs that blend into AnyCreek’s existing design.
This saved development time and their future improvements (like adding new metrics or letting users customize charts) will require minimal effort. AnyCreek expects the new analytics to boost user engagement and drive growth: guides are more likely to log in frequently and use the platform when they can easily track their performance.
End users (the guides) benefit from gaining instant visibility into how their guiding business is performing – they can see revenue trends, booking patterns, and other key statistics at a glance. Overall, embedded analytics helped AnyCreek showcase the value it provides to its guides, strengthening customer satisfaction and loyalty.
2 Concept X
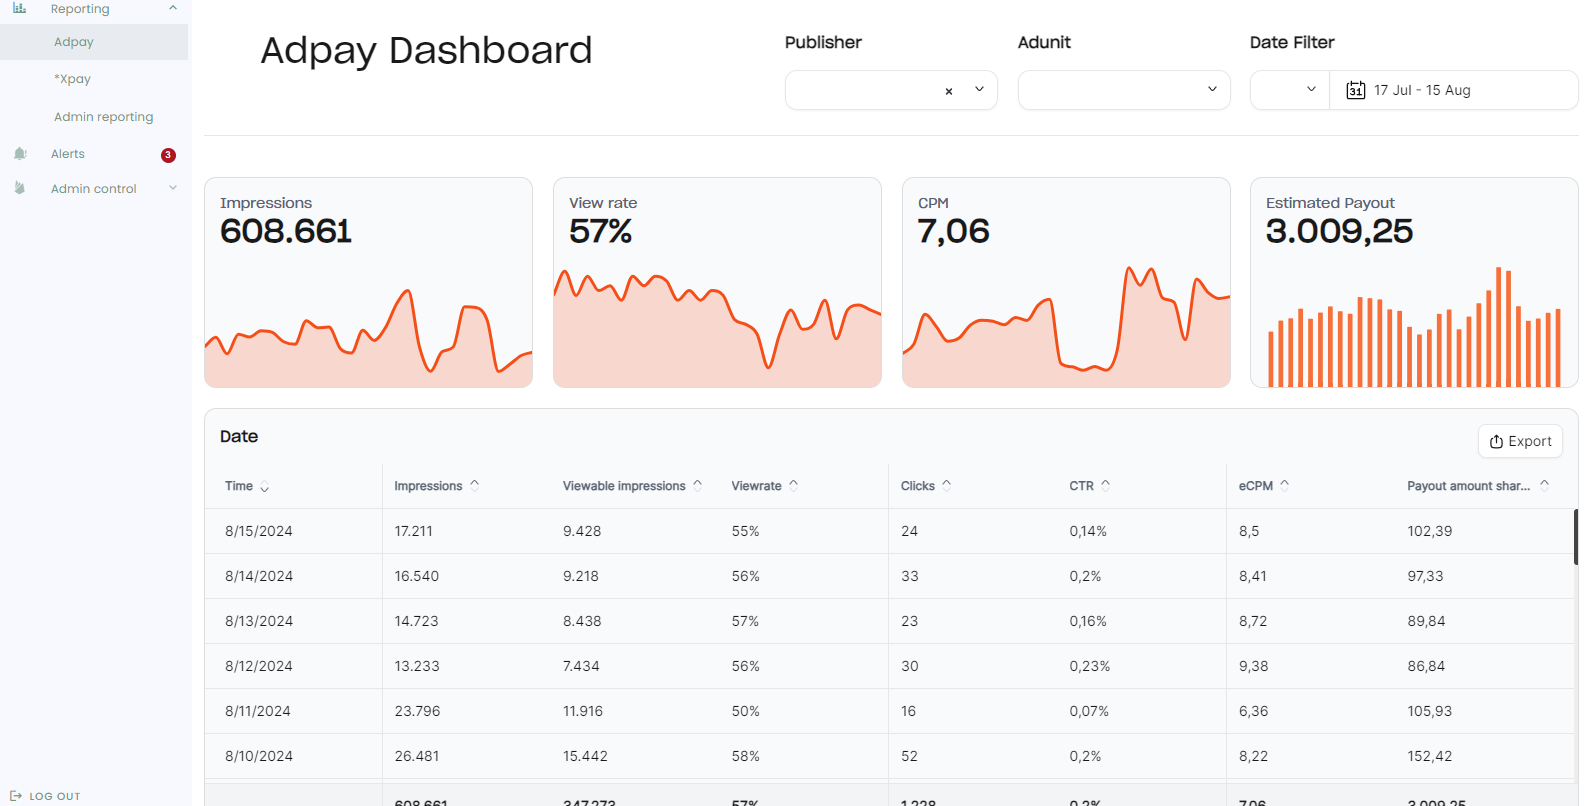
Concept X is a Nordic digital advertising agency working with major brands like Nike, Samsung, PlayStation, and Coca-Cola. They specialize in delivering engaging, high-performance online ad campaigns, blending creativity with data-driven strategy to help big-name clients reach their audiences.
Use case
The team at Concept X needed a better way to present analytics both internally and to clients. They had a custom-built analytics dashboard in Vue.js, using ECharts and Chart.js, for monitoring campaign KPIs, but it was difficult to maintain and update.
They planned to create an internal dashboard for their own KPIs and a client-facing one for each customer’s campaign data. However, making even small changes to their custom solution required engineering work, which slowed them down. They looked at off-the-shelf BI tools (like Superset or Grafana) to embed analytics, but those either lacked flexibility or would require heavy tweaks to match their app’s look.
Embeddable emerged as the ideal middle ground: it offered the full customization of a custom build (even letting them use their own front-end components) without the overhead of coding everything from scratch.
That meant Concept X could deliver dashboards that felt native to their app and easily adjust them as needed, all while keeping their developers focused on core product work.
The outcome
By adopting Embeddable, Concept X dramatically sped up their analytics development cycle. Instead of writing new code for every chart or minor update, their team can now build and modify dashboards in a fraction of the time.
This faster iteration allows them to respond quickly to new reporting needs and fine-tune metrics for clients without a heavy development lift. The end result for clients is a superior analytics experience: each client gets a secure, self-service dashboard within Concept X’s platform that is both visually polished and tailored to their data.
It’s a significant upgrade from the old static charts since clients can now interact with their data, view the metrics that matter to them, and trust that the visuals align perfectly with Concept X’s branding.
3 mpathic AI
mpathic AI is a Seattle-based tech company bringing AI-powered oversight to clinical trials. Its platform analyzes conversations and contextual data from trial participants, mentors, and supervisors to improve accuracy and safety in clinical research. By flagging potential issues (like misconduct or protocol deviations) through these insights, mpathic helps trial organizers ensure high quality and patient safety.
Use case
The mpathic team needed to embed robust analytics into their SaaS platform for users like trial mentors and supervisors. They wanted dashboards to monitor trial “fidelity” – tracking everything from protocol adherence to anomalies in participant interactions. Their original analytics feature was a custom React + Highcharts solution with some backend configuration.
It worked, but every new chart or update meant writing code and deploying changes, which was slow. The goal was to offer a more dynamic, self-serve analytics experience, similar to tools like Kibana or Grafana, directly within their app, without burdening their small development team. They explored various solutions (including Luzmo and Highcharts’ own dashboard tools), and Embeddable stood out.
It promised easy integration into their codebase, full control over the look and feel, and fast performance for end users. Embeddable’s use of a semantic layer (Cube.dev) aligned well with mpathic’s data stack, adding to the appeal.
The outcome
Using Embeddable slashed the development overhead for mpathic AI’s analytics. The team can now adjust or create dashboards via a no-code builder instead of coding everything by hand. Impressively, they delivered a top customer request – letting each client configure their own dashboards – in just two weeks (a feat that would’ve taken much longer building in-house).
This rapid turnaround cleared their backlog of analytics improvements and let the engineers refocus on core product innovations. End users benefit from a far more flexible and insightful analytics experience. They can access real-time dashboards to track trial progress and safety metrics, and even adjust views or filters themselves, all within mpathic’s application.
The analytics are faster and more dynamic, helping these users detect issues early and make data-driven decisions to keep clinical trials on track.
4 Eyk
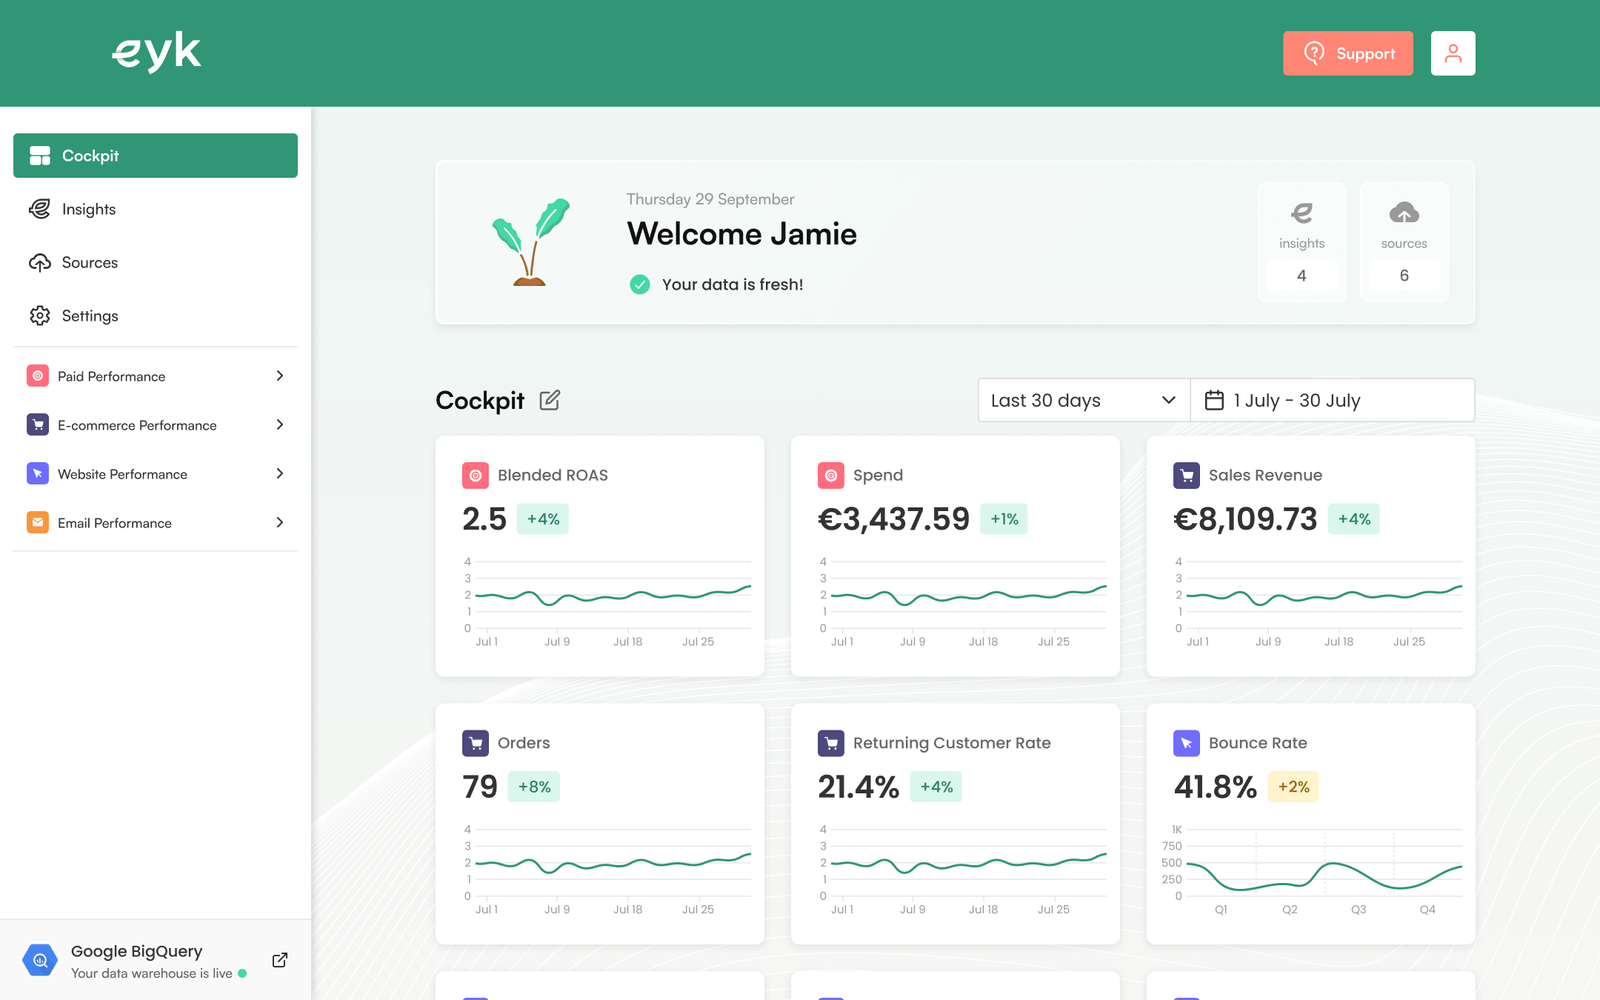
Eyk is a marketing technology platform that brings together all of a company’s e-commerce metrics into one dashboard. By connecting to the tools businesses use to run their online stores, Eyk gives a unified, real-time view of key customer data, such as marketing performance, sales figures, customer behavior and more.
In essence, Eyk offers a ready-made analytics cockpit for online businesses to monitor and optimize their performance across various channels and systems.
Use case
Eyk’s founding team needed to develop an in-app “marketing cockpit” for their users – a dashboard showing key e-commerce KPIs (like sales, campaign ROI, customer segmentation, etc.) at a glance. Since they were starting from scratch with no existing solution, speed was a priority.
They wanted a solution that allowed them to embed beautiful, interactive charts in their React app quickly, but also gave them the flexibility to customize the experience fully to match Eyk’s brand. After reviewing options from open-source BI tools to other embedded analytics libraries, they chose Embeddable.
It provided an ideal mix of rapid development (with a ready-to-use chart library and visual builder) and total control (ability to code custom components when needed). Embeddable is also aligned with their technical needs by supporting single-tenant databases for each client (important for data isolation) and offering a predictable flat pricing model that fits a startup’s budget.
The outcome
Thanks to Embeddable, Eyk rolled out its e-commerce analytics dashboard much faster than if they had built it alone. They were able to deliver a polished reporting feature to their customers early on, which generated immediate excitement and positive feedback.
Users loved having a slick, comprehensive dashboard right inside the product to track all their metrics. The Eyk team found that integrating and tweaking the dashboards was straightforward – they could adjust layouts, add new charts, or refine calculations without requiring a lot of development effort.
“Embeddable has enabled us to improve the experience for our users in a way and timespan that we wouldn't have achieved otherwise."
This not only saved their engineers' time, but it also means the analytics can continuously evolve based on user feedback. Eyk’s co-founder noted that Embeddable enabled them to improve user experience in ways and in a timeframe they wouldn’t have achieved otherwise.
5 HONK
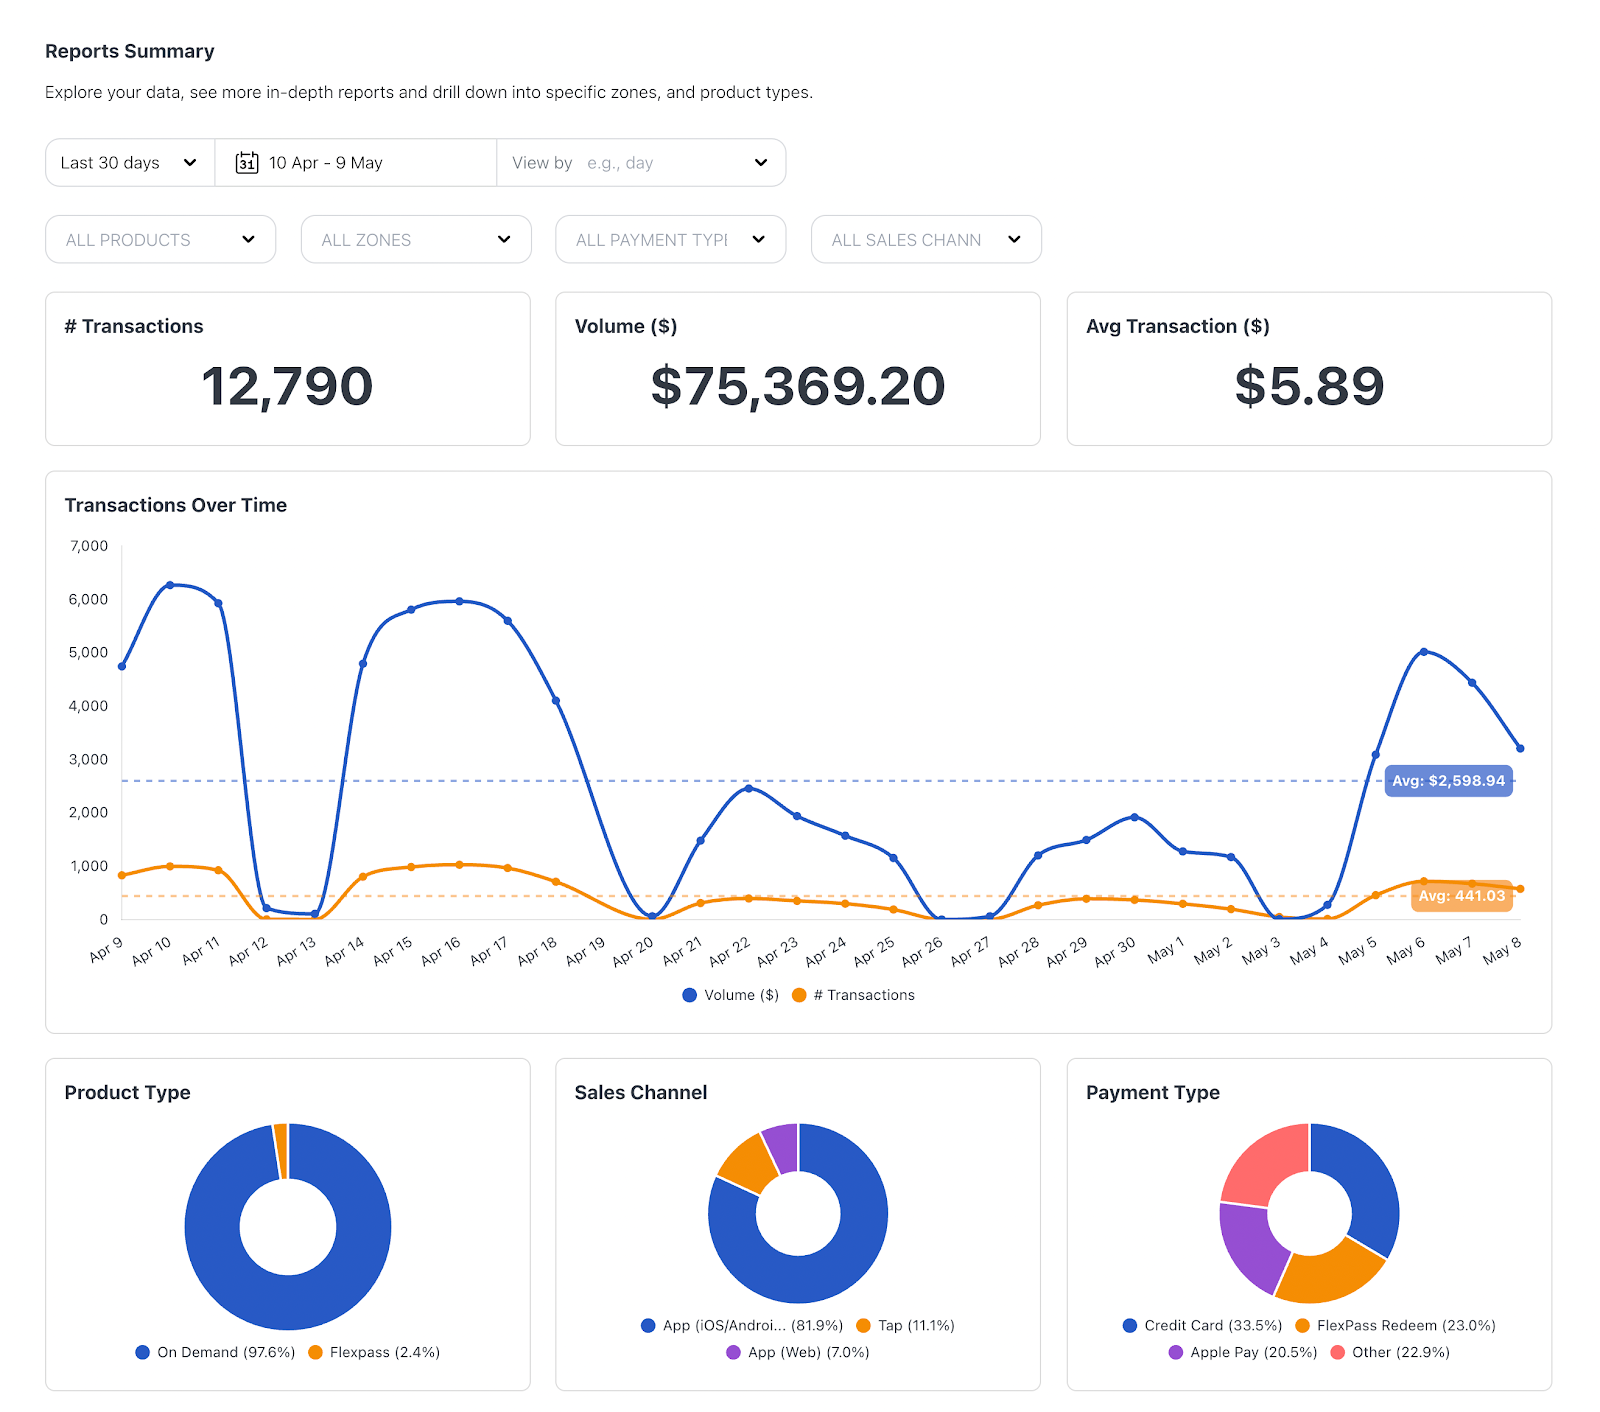
HONK is North America’s leading platform for self-serve, unattended parking payments. It provides a turnkey parking management system that lets drivers pay via mobile devices, eliminating the need for pay stations or attendants.
Used at thousands of locations across the US and Canada, HONK streamlines parking operations and makes payments effortless for users.
Use case
HONK set out to build a reporting dashboard within its product to help parking lot operators see how their business is performing. They envisioned two kinds of views: a quick daily summary (hourly sales, etc.) and a more comprehensive analytics page for digging into trends over time.
Initially, their analytics were powered by manual SQL queries and Chart.js visualizations, which were tough to maintain or modify. When new insights were needed or HONK introduced a new service, updating the reports was a slow, developer-heavy process.
The team realized they needed a more flexible embedded analytics solution that would make the dashboards feel like a natural extension of their app. Using their internal BI tool (Metabase) externally wasn’t ideal, as it wouldn’t match their UI or give them enough control.
Embeddable stood out as the best choice because it offered complete control over the UX (so the dashboards looked and felt native), lightning-fast load times for charts, and an easy way for HONK’s team to build and iterate on dashboards without excessive coding. Plus, Embeddable’s pricing was predictable and fit their needs.
The outcome
With Embeddable, HONK transformed how it delivers analytics. The product management and design teams can take ownership of dashboard creation using the no-code visual builder, shaping the reports from the end-user’s perspective without waiting on engineering for every tweak.
This empowerment led to much faster development cycles and took a huge load off the developers’ shoulders. The initial release of the new reporting feature was met with excitement: virtually all of HONK’s clients started using the dashboards as soon as they went live, eager to explore the data at their fingertips.
Internally, the sales team quickly made the analytics a highlight in demos, since having built-in reporting gives HONK a competitive edge, especially for prospective customers who lack their own BI tools.
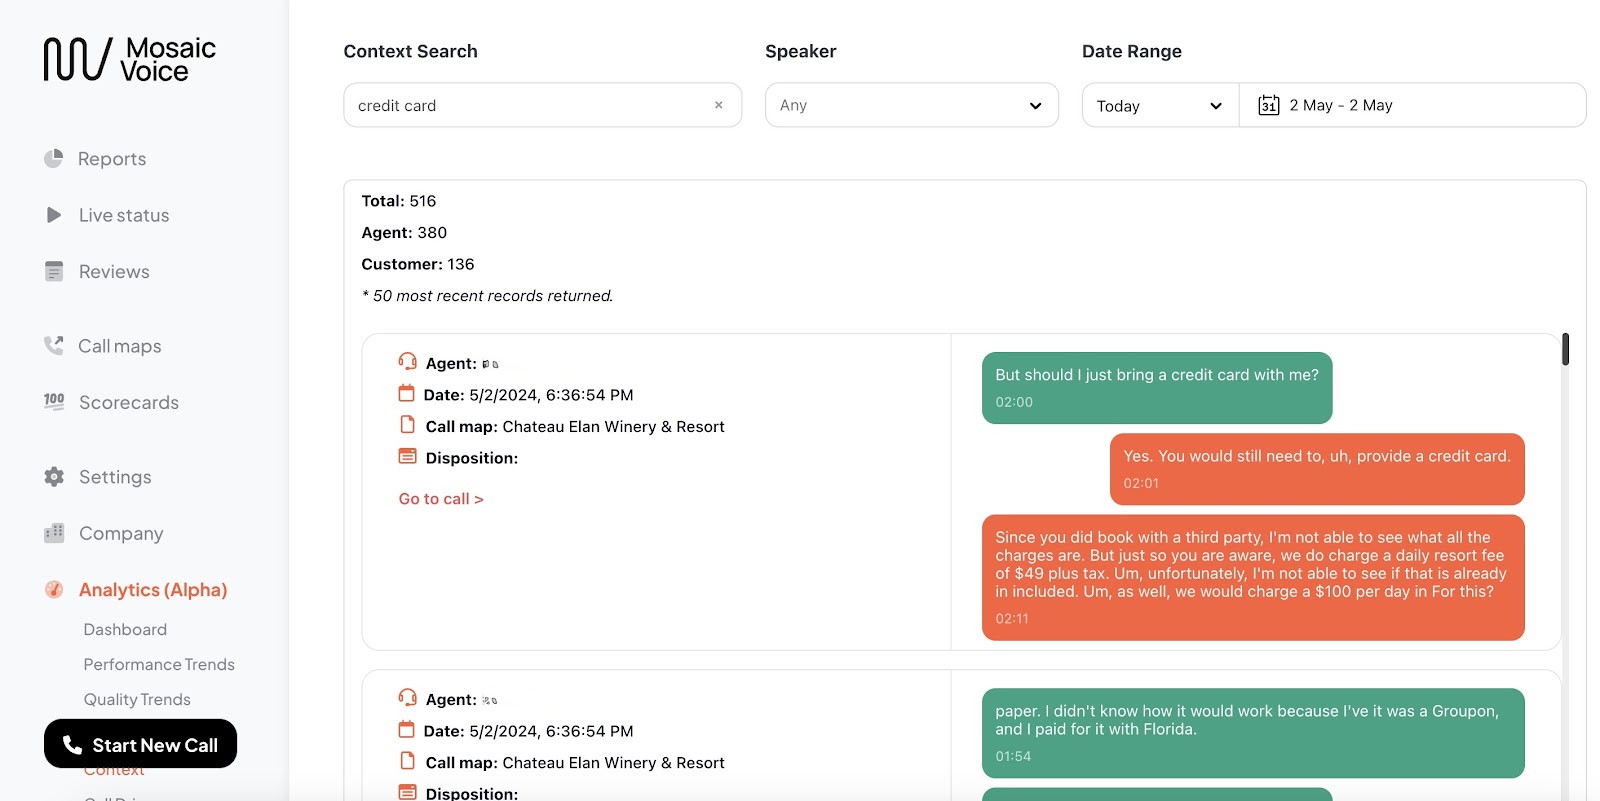
6 Mosaic Voice
Mosaic Voice is a startup on a mission to simplify and modernize call center software. They believe traditional call center systems are overly complicated and unwieldy, so they’re building a more seamless, intuitive platform.
Mosaic Voice’s solution gives call center teams an easy-to-use interface to handle calls and analyze interactions without the usual headaches.
Use case
Mosaic Voice needed to embed analytics dashboards into their product to display important call center metrics and trends. At first, they built these dashboards in-house using React and an open-source library (ChartKick).
While functional, this custom approach had downsides: some dashboards were slow to load, and adding new charts or custom features for different clients was time-consuming for their developers. To deliver a truly standout experience (and compete with larger vendors), they sought an embedded analytics solution that combined speed, flexibility, and ease of customization.
They tried tools like Amazon QuickSight, Vizzly, and Trevor.io, but none met all their criteria. Embeddable, however, checked every box. It allowed them to integrate high-performance, fully customizable charts that blend into their app’s UI.
Equally important, Embeddable’s no-code builder enabled Mosaic Voice’s team (not just developers) to assemble and adjust dashboards on the fly – a big advantage for a lean startup.
The outcome
After using Embeddable, Mosaic Voice was able to develop and roll out dashboards at an impressive pace. In just two weeks, they built roughly 10 different dashboards, covering everything from real-time call stats to custom transcript search tools.
Because they could start with Embeddable’s ready-made components and then tweak or extend them as needed, development was incredibly efficient. The result is that Mosaic Voice’s analytics look polished and load extremely fast for users. In fact, their CEO commented that the user experience they now provide even surpasses some competitors who have teams and budgets ten times larger.
For a startup, outshining bigger players is a huge win. Moreover, Embeddable freed up their engineering resources: product managers and even non-technical staff can create or modify dashboards through the intuitive builder, leaving developers to focus on core product improvements.
End users, such as call center managers, benefit from rich, interactive insights built into the software. They can quickly review key performance metrics, search through call transcripts for insights, and visualize data in a way that’s easy to understand and act upon.
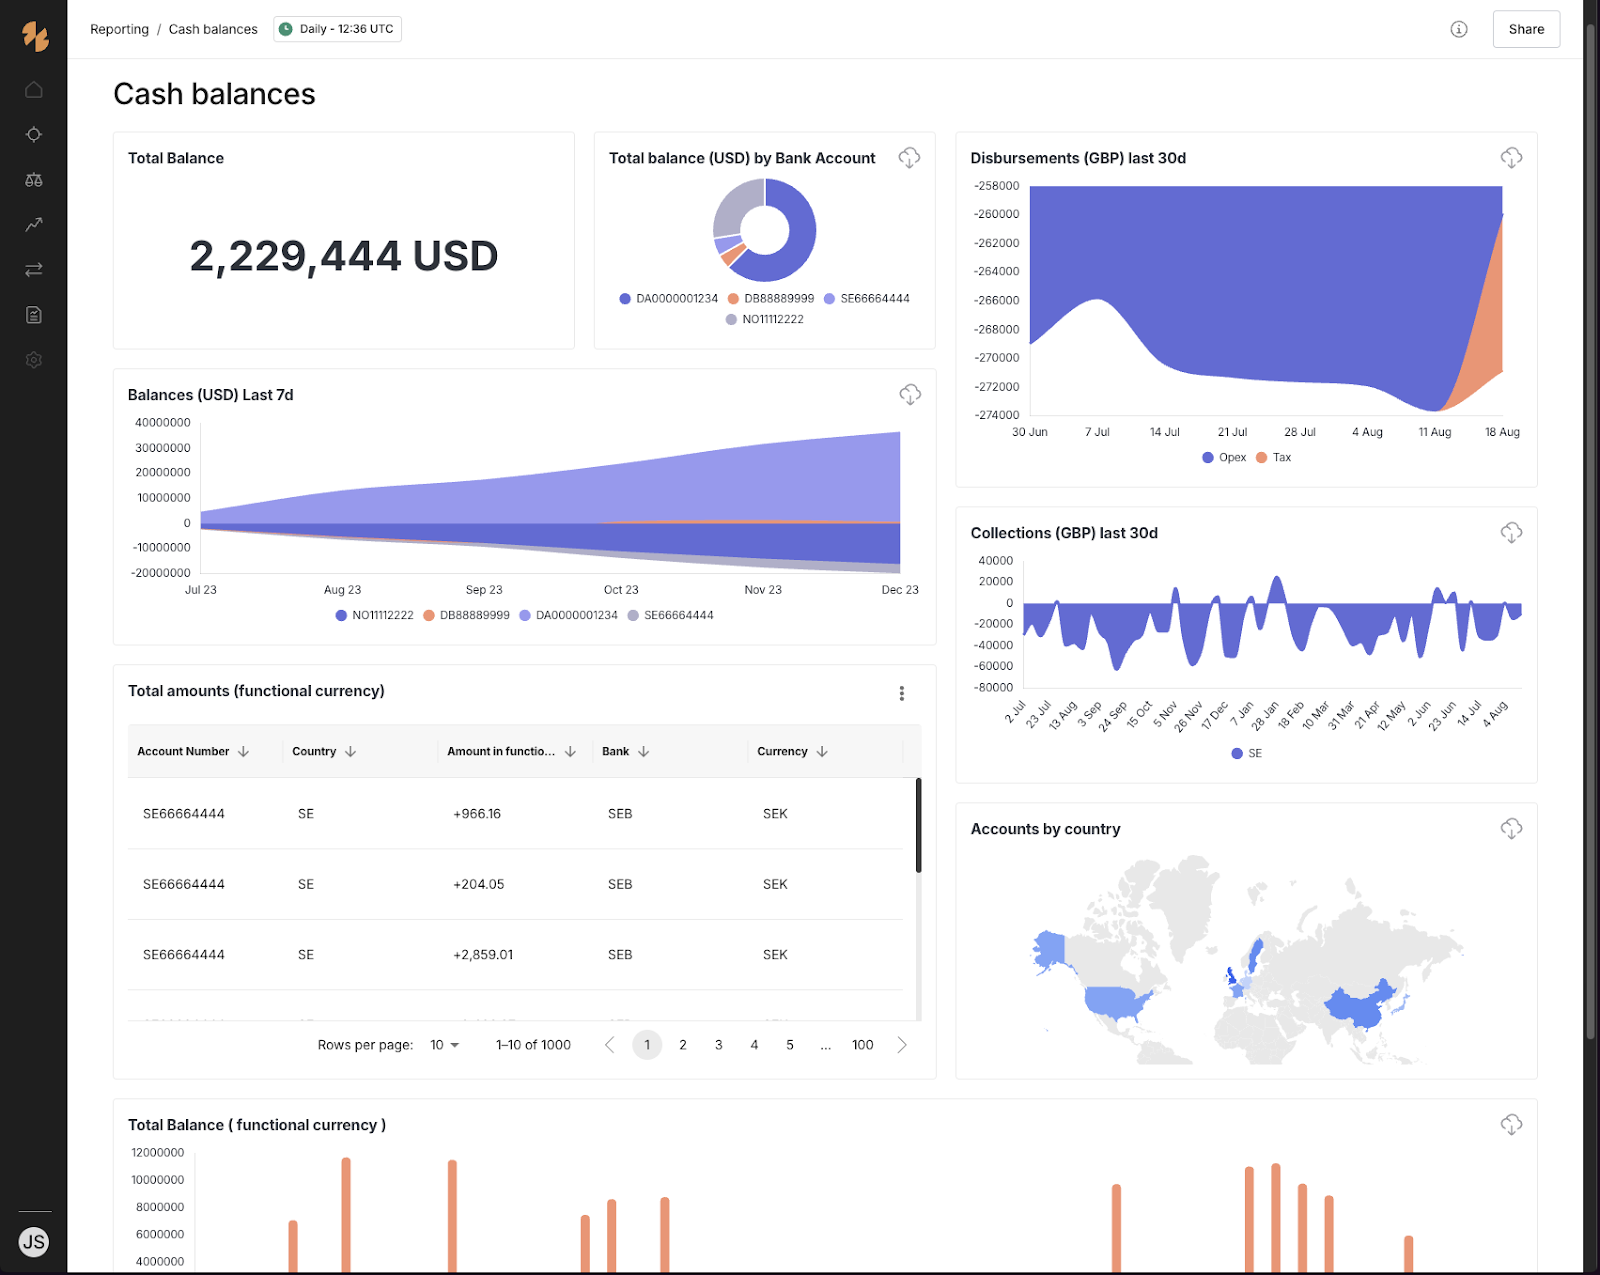
7 Palm Technologies
Palm (Palm Technologies) is a fintech company offering a “Treasury OS” for businesses. Their platform helps companies understand and free up their operational cash. Palm provides automated workflows for cash forecasting and movement, all with enterprise-grade security and controls.
Use case
Palm wanted to build an embedded analytics and reporting module within their application, tailored for enterprise treasury teams. The vision was to let users (treasury managers) drill into their banking and cash data directly in Palm, and even create custom reports or dashboards to share with colleagues.
Before Embeddable, Palm had some basic charts in their product using Recharts and Material-UI, but they lacked any self-service capabilities for end users. The team knew that enabling users to create personalized dashboards would add a lot of value, but developing a full self-serve analytics feature in-house would be complex and time-consuming to maintain.
They explored options and eventually found Embeddable via a web search. After speaking with the Embeddable team, Palm realized it was the closest match to what they needed – more fitting than retrofitting a traditional BI tool or trying to build something from scratch.
Embeddable offered fully customizable components (so Palm could maintain their clean UI design), very fast-loading visualizations, and crucially, a newly launched feature for end-user dashboard personalization. These factors, combined with strong support and an easy integration process, made Embeddable the top choice.
The outcome
By integrating Embeddable, Palm quickly delivered a powerful new reporting tool to their customers without overburdening their developers.
Palm’s engineering team appreciated how easily the Embeddable SDK fit into their React frontend and how responsive the Embeddable support was during implementation. Jason Southin, a full-stack engineer at Palm, described Embeddable as “a valuable addition to our toolkit” that added a major feature for customers along with a new technology for their team to build with.
The end result is that Palm’s enterprise users can now slice and dice their financial data on their own. They can generate custom dashboards to track things like cash balances by bank, forecast vs. actual spend, or any other metric – all within Palm’s interface, no spreadsheets needed.
This self-service analytics capability makes Palm’s platform far more useful and sticky for clients, as finance teams get insights instantly and can share interactive reports with the wider team. Meanwhile, Palm’s developers can continue to iterate on and extend the analytics with ease, knowing they have a flexible foundation in place.
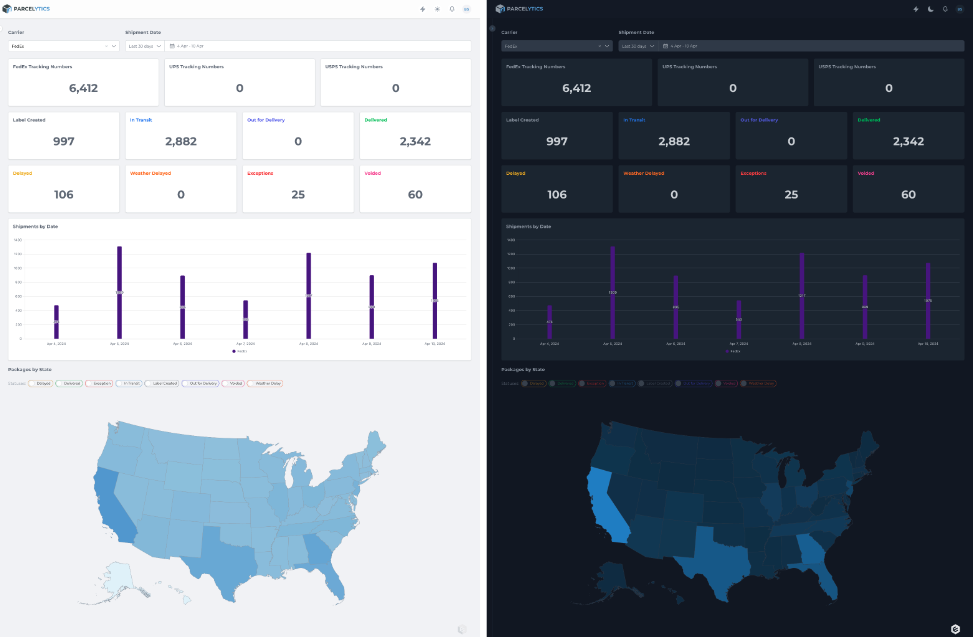
8 Parcelytics
Parcelytics is a platform that helps companies gain control over their shipping operations through data. It gives businesses visibility into their shipping costs, package delivery statuses, surcharges, and inefficiencies.
By analyzing shipping patterns and identifying issues (such as costly routes or carrier errors), Parcelytics enables its customers to ship more efficiently and reduce their logistics costs.
Use case
Delivering clear, actionable shipping analytics is central to Parcelytics’ value, so having a great embedded dashboard was critical.
Initially, they provided an in-app analytics view via a third-party tool (VerbData). When VerbData was acquired and became unavailable, Parcelytics needed to replace its embedded analytics solution quickly. The team tried many alternatives: tools like Plotly, Metabase (and its hosted version, Preset), Apache Superset, and Explo.
Each came up short, whether due to limited customization, clunky user experience, lack of caching for speed, or constraints on how charts could be embedded.
Frustrated with these limitations, Parcelytics turned to Embeddable and found it met all their needs. Embeddable made it easy to build and integrate new dashboards and offered the flexibility to completely tailor the look and behavior of those dashboards within their Angular application.
Just as important, the Embeddable team provided top-notch support, giving Parcelytics confidence in a smooth transition.
The outcome
With Embeddable powering their analytics, Parcelytics was able to design a more impactful user experience. They are no longer confined to generic iframes or static embeds; instead, they can seamlessly weave charts and data visualizations into their app wherever it makes sense.
The result is analytics that feel truly native and contextual, allowing users to view, for example, a cost chart right next to a list of shipments and immediately connect the dots. This level of integration makes insights more accessible and useful.
Secondly, Embeddable’s flexibility lets Parcelytics tune the complexity of each dashboard to the audience. They can present simplified views for non-technical users or more detailed analytics for power users, all with a consistent, easy-to-use interface.
The Parcelytics developers also found the implementation process to be the smoothest they’d experienced for a BI tool (no need for messy iframe workarounds). Now, clients have no trouble getting the insights they need: they can easily see where their shipping spend is going, spot anomalies or surcharges, and take action.
Meanwhile, Parcelytics can continue to enhance their analytics features without the bottlenecks they encountered before.
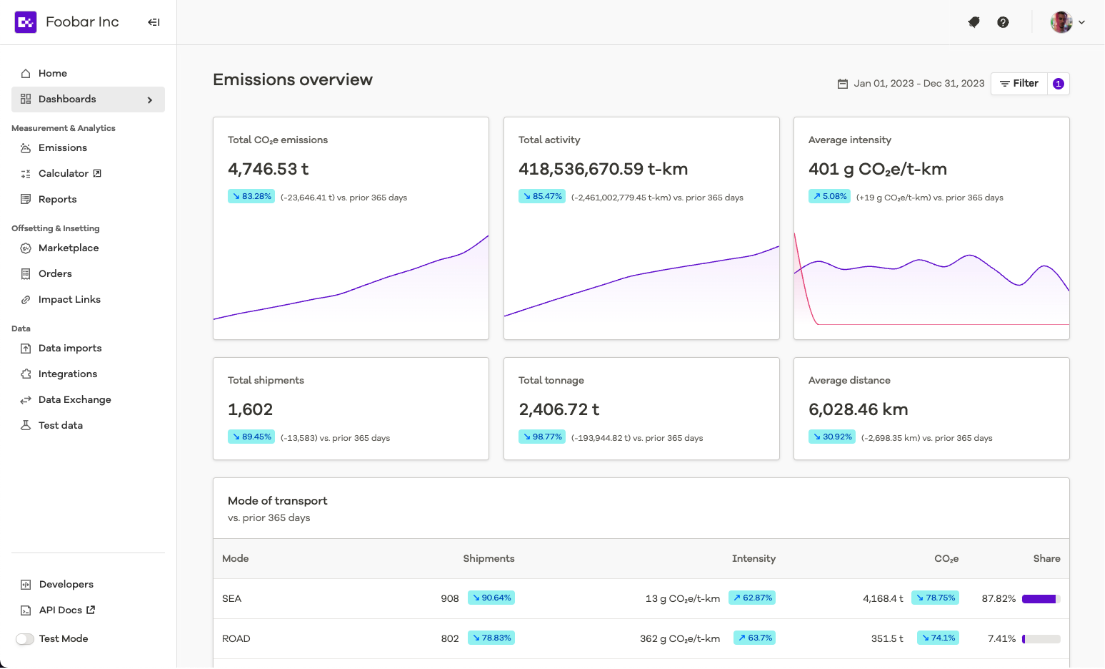
9 Pledge
Pledge is a climate tech startup on a mission to decarbonize supply chains. Its platform helps freight forwarders and logistics companies measure, report, and reduce their carbon emissions, especially the tricky “scope 3” emissions that occur throughout their partners and suppliers.
By enabling these companies to track emissions data and implement reduction or offset strategies, Pledge aims to accelerate the transition of global freight towards net zero.
Use case
To deliver value to their users, Pledge needed to embed interactive dashboards in their app that display shipments and associated emissions data. The key requirement was offering multiple ways to aggregate and view this data so that users wouldn’t have to export it to spreadsheets or build reports manually. And everything had to feel seamless and on-brand within Pledge’s web application.
The team explored multiple solutions: open-source BI tools like Superset (and its managed version Preset), and even building a custom analytics module on top of Cube.js. However, those paths either fell short in terms of user experience or required too much engineering effort for a startup.
Embeddable proved to be the ideal choice. It let Pledge achieve a fully custom look and feel for their dashboards while using a no-code builder to create them – essentially the best of both worlds. They retained complete control over the UX (ensuring the analytics blend perfectly with their app) and benefited from a pricing model that scales reasonably with their growth.
A bonus: Embeddable’s architecture uses Cube.dev for the data layer, providing powerful data modeling capabilities that Pledge could leverage immediately.
The outcome
Implementing Embeddable has been a big win for Pledge. Their developers quickly integrated the SDK thanks to clear documentation, and they got initial dashboards live in a short time. Now, team members who aren’t engineers can adjust and create dashboards via Embeddable’s no-code interface, freeing up developers for other work.
For Pledge’s customers, the difference is night and day – instead of manually crunching numbers, they have slick, real-time dashboards within Pledge’s app to monitor shipments and emissions. They can switch between different breakdowns (by time period, by carrier, by route, etc.) with a few clicks and trust that the data is always up to date.
Using Embeddable, Pledge fully accomplished their goal of building no-code, custom-component dashboards that maintain their cohesive, professional design. And because Embeddable (with Cube.dev) handles the heavy lifting behind the scenes, Pledge can continue to develop even more sophisticated insights without reinventing the wheel.
“Using Embeddable, we have successfully achieved our goal of building dashboards with a no-code solution that use our own components. The platform has allowed us to maintain our desired look and feel, ensuring a cohesive and professional appearance for our end users."
10 Resident Advisor
Resident Advisor (RA) is a major online platform in the electronic music scene. Founded in 2001 by dance music enthusiasts, RA helps people discover electronic music events, artists, and releases worldwide.
It’s known for event listings, ticket sales, and community content – all driven by a passion for the scene and run by an independent team of music lovers.
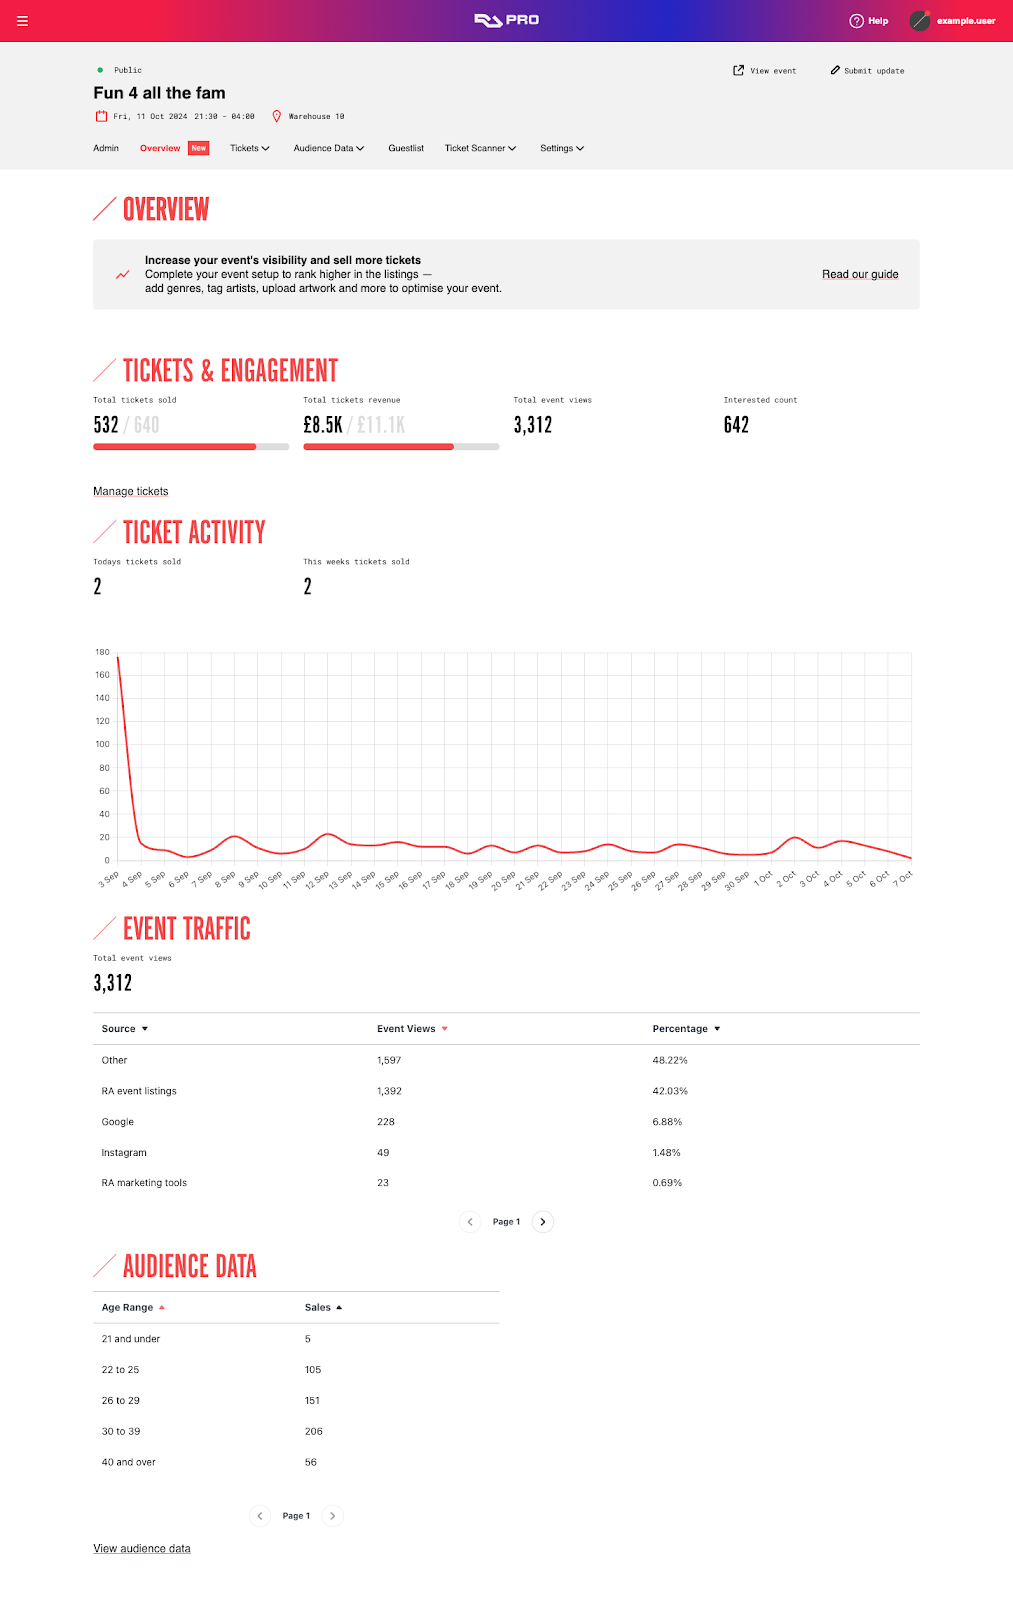
Use case
One of RA’s revenue streams comes from RA Pro, which allows event organizers and promoters to advertise on the site. The RA team needed to give these advertisers a better view of how their ads were performing across RA’s channels. They had a custom-built dashboard showing basic metrics (impressions, clicks, etc.), but adding new insights was slow because it required engineering to code changes.
RA wanted a way to iterate quickly on these analytics, delivering more data to RA Pro customers without heavy dev involvement. They looked into embedding analytics tools like Metabase and Mixpanel, and weighed continuing with their Cube.js-powered custom approach.
The off-the-shelf tools, however, couldn’t be tailored enough and felt too external, while building everything from scratch was taxing. Embeddable offered a perfect middle ground. It enabled RA to craft an analytics dashboard that felt completely native to their site, maintain full control over visuals and data, and let non-developers update content via a no-code builder.
The Embeddable team was also very receptive to feedback – they even implemented some of RA’s suggestions, which gave RA confidence that the solution would keep improving to meet their needs.
The outcome
With Embeddable, RA has dramatically sped up how it delivers analytics updates. The product and data teams can now make many dashboard changes on their own via the Embeddable builder, rather than waiting on development sprints.
This agility means RA can respond to advertiser requests for new metrics or reports much faster than before. It also frees up the engineering team to focus on core product improvements instead of tweaking charts. For RA’s clients (the event promoters), the benefits are clear: they are seeing more useful data, presented in dynamic, interactive ways, which helps them gauge their ad performance and ROI on RA.
RA expects that giving advertisers these richer insights will boost client satisfaction and retention, and even help win new advertisers by showcasing RA’s value-added services.
Moreover, the embedded dashboards look and feel like an integral part of RA’s platform and load quickly, so users get a seamless experience when checking their stats.
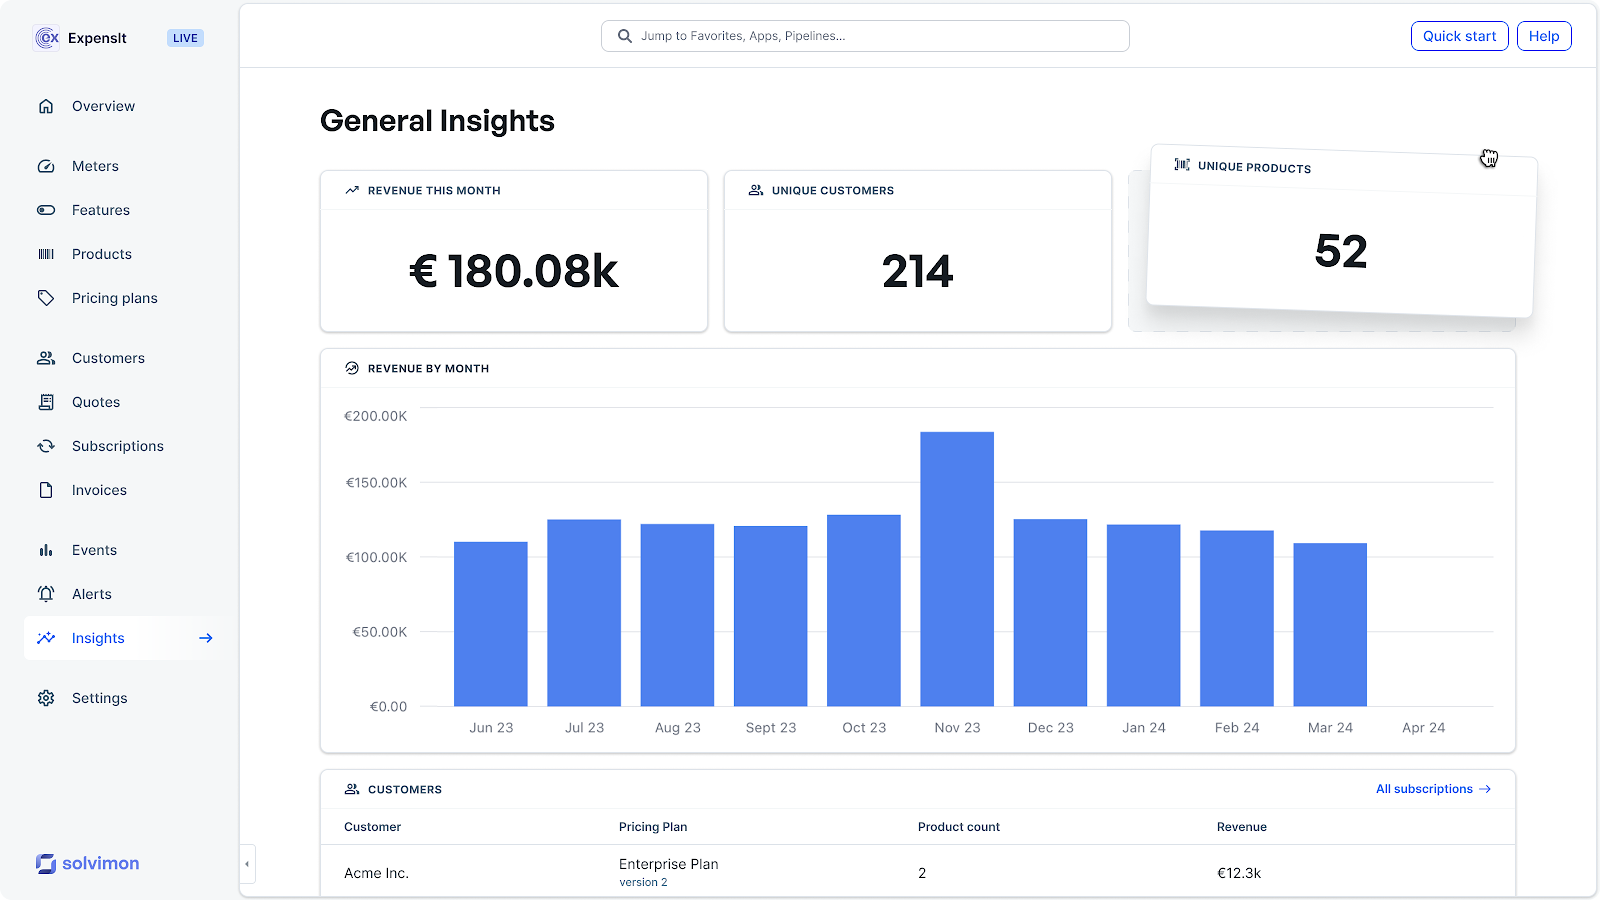
11 Solvimon
Solvimon is a next-gen billing platform that helps fast-growing businesses manage billing and pricing operations with ease. Founded by former Adyen tech leaders, Solvimon provides flexible, automated billing solutions tailored to each client’s needs.
Use case
Solvimon wanted to give its customers better insights into their entire “quote-to-cash” process – from initial quotes to final payment. That meant embedding analytics for things like revenue trends, product usage stats, and quote conversion rates directly into the app.
At first, they embedded Metabase (after comparing options like Looker and Holistics) to get some basic dashboards up quickly. Metabase was an okay short-term fix, but it lacked customization and wasn’t built for the long haul, especially since Solvimon anticipated needing to let their clients’ own customers view analytics too.
When seeking a more permanent solution, they evaluated Vizzly and Luzmo (Cumul.io). Vizzly didn’t allow custom front-end components (limiting Solvimon’s control of the UI), and Luzmo had a pricing model that broke down for Solvimon’s multi-tenant scenario.
Embeddable, by contrast, ticked all the boxes. It offered lightning-fast analytics loading, the ability to make the dashboards look and feel native in Solvimon’s Vue app, and a flat-rate pricing model that meant they could include unlimited end users without a huge cost spike.
The fact that Embeddable uses Cube.js under the hood for the data layer was another plus, aligning well with Solvimon’s tech stack and giving them confidence in scalability.
Benefits
By adopting Embeddable, Solvimon sped up development and enhanced its product. They can now ship new or updated data visualizations roughly 20% faster than before, since many changes no longer require back-end work – the team can adjust dashboards on the front-end via Embeddable’s tools.
This means new analytics features roll out in days instead of weeks, keeping pace with customer needs. Solvimon also benefited from Embeddable’s excellent support and rapid improvements: feature requests were taken seriously and often delivered quickly, sometimes within weekly releases.
Their developers noted that integration was smooth and support questions were answered within minutes, making the whole process painless. For end users, the advantages are clear: they’re seeing a steady stream of new analytics capabilities inside the Solvimon platform.
They can view real-time revenue dashboards, breakdowns of usage, and other key metrics through a sleek, branded interface that matches the rest of the app.
Embed dashboards into your platform with Embeddable
For an embedded analytics platform to do its job well, it needs to meet several criteria. It needs to be flexible and customizable, so it blends in perfectly into the surrounding product. Developers should be able to embed it without using iframes or proprietary languages built for one BI platform. The dashboards should load quickly and provide a superb user experience.
We'd talk about flat-rate pricing with unlimited usage, connectivity with data sources and other factors, but there's only so much time in the world. Why waste it reading when you can simply get access to Embeddable?
Frequently asked questions
1. What are some real examples of embedded analytics in software products?
Shopify shows store owners sales data, customer activity, and traffic numbers right inside the app. This makes it easier to track performance without switching tools.
Many store owners amplify these insights by pairing Shopify analytics with powerful email marketing tools like Omnisend. For inspiration, check out these Shopify stores examples with Omnisend to see how leading brands turn data into high-converting, automated campaigns.
2. How can embedded analytics help my product?
It lets your users see important data without leaving your app and can also be used to offer premium features. This saves time for your team and improves the product’s value.
3. Which industries are a good fit for embedded analytics?
Any software company could benefit. Industries like SaaS, finance, e-commerce, education, and healthcare all use embedded analytics to give users access to real-time information inside their platforms. It enables teams to ship value and iterate faster versus a custom build.